Each year, Enigma Software, the makers of the SpyHunter anti-spyware solution, release a list of the top 20 US cities most infected with malware.
This ranking is based on telemetry data received from the SpyHunter product, and this year 's data included details from four million malware infections across the US. Only 150 of the US' biggest city were taken into account.
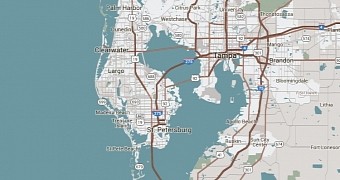
In the ranking released last year, with data from 2014, Tampa, Florida was the city with most malware infections in the US. This year, in 2015, Tampa kept its top position, with an infection rate five times bigger than the national average.
Second was last year's third place ranked city, Saint Louis, Missouri, that had an infection rate four times bigger than the national average. Saint Louis switched places with Orlando, Florida, who ranked third in 2015.
The rest of the top ten is occupied by Denver, Atlanta, Newark, Salt Lake City, Madison, Cleveland, and Cincinnati.
The biggest riser in this ranking was Buffalo, who jumped from 47th to 17th.
Enigma Software says that most infections occurred via Web pages. "Because of the growth in online communication - be it Facebook, Linkedin, Twitter, Pinterest, Instagram or other social networking platforms, there are now more ways for cybercriminals to reach out and trick people into clicking on links," said Patrick Morganelli, senior vice president of Technology at Enigma Software.
Top Cities for Malware Infections
| 2015 | 2014 | City | Infection rate |
|---|---|---|---|
| 1 | 1 | Tampa | 506% higher than the national average |
| 2 | 3 | Saint Louis | 392% higher than the national average |
| 3 | 2 | Orlando | 375% higher than the national average |
| 4 | 6 | Denver | 333% higher than the national average |
| 5 | 4 | Atlanta | 327% higher than the national average |
| 6 | 7 | Newark | 241% higher than the national average |
| 7 | 5 | Salt Lake City | 223% higher than the national average |
| 8 | 8 | Madison | 193% higher than the national average |
| 9 | 9 | Cleveland | 184% higher than the national average |
| 10 | 11 | Cincinnati | 170% higher than the national average |
| 11 | 10 | Little Rock | 164% higher than the national average |
| 12 | 12 | Washington | 162% higher than the national average |
| 13 | 13 | Miami | 114% higher than the national average |
| 14 | 17 | Raleigh | 98% higher than the national average |
| 15 | 15 | Irvine | 96% higher than the national average |
| 16 | 14 | Pittsburgh | 87% higher than the national average |
| 17 | 47 | Buffalo | 87% higher than the national average |
| 18 | 18 | Minneapolis | 85% higher than the national average |
| 19 | 16 | Richmond | 81% higher than the national average |
| 20 | 19 | Seattle | 72% higher than the national average |

 14 DAY TRIAL //