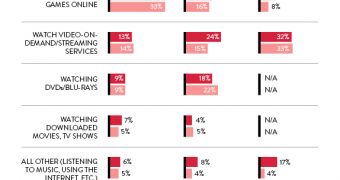
Xbox 360 owners spend the least amount of time using video-on-demand applications or streaming services, as many prefer to actually play on their console instead of watching other content, according to a survey made by Nielsen.
Microsoft is betting big on entertainment and wants to turn the current Xbox 360 into a true hub for the living room of any family by emphasizing entertainment apps and services that provide video-on-demand.
What's more, recent rumors also claim that the same heavy emphasis on entertainment will also be observed when the Xbox 720 is presented to the world later this year.
Surprisingly, however, a new survey made by Nielsen shows that Xbox 360 owners don't really like video-on-demand, as they spend the least amount of time (13%) using such things when interacting with the console, as opposed to PS3 owners, who spend 24 percent of their time, and Wii users, who are at 32%.
"PlayStation 3 users—who drove the trend in increased streaming activity—spent nearly 25 percent of their console time streaming content in 2012, up from 15 percent during the prior year. Wii users remained the most likely to spend their console time using VOD and streaming (32%), while Xbox 360 users spent about 13 percent of their usage time for VOD and streaming content, the same amount of time as last year," Nielsen observed.
What's more, the survey shows that console owners still like to actually play games on these devices, allocating lots of time both to single-player and online experiences.
"Beyond video, users of seventh-gen consoles are also unique in how they use their multi-functional systems. In 2012, Xbox 360 users spent the most time (33%) gaming online, while Wii users spent the highest share of time (40%) playing games offline. DVD/Blu-ray use in gaming consoles is declining, given the rise in VOD and streaming, but PS3 users were still the most likely to spend time watching DVDs/Blu-rays (18%)."
You can check out the full data in the infographic above.

 14 DAY TRIAL //