14 DAY TRIAL //
 Whenever your operating system would hit you with a crash there was not too much to do except restart your computer and maybe looking on the Internet for the prompted error in search for a cause. Generally these crashes will not multiply if you re-install your Windows.
Having a monitoring tool that records all the mischiefs taking place on your computer and gathering them all in a report would seem like the most appropriate solution to prevent the unpleasant events. Windows XP was not equipped with such a tool and the user did not have an insight on the reliability of the OS after some time.
In Vista, Microsoft thought of helping the average user learn more about the state of the computer and introduced the Reliability and Performance Monitor. This tool is exactly what its name says: a monitor. It collects data regarding the performance of your computer and stores it in a report file you can consult later.
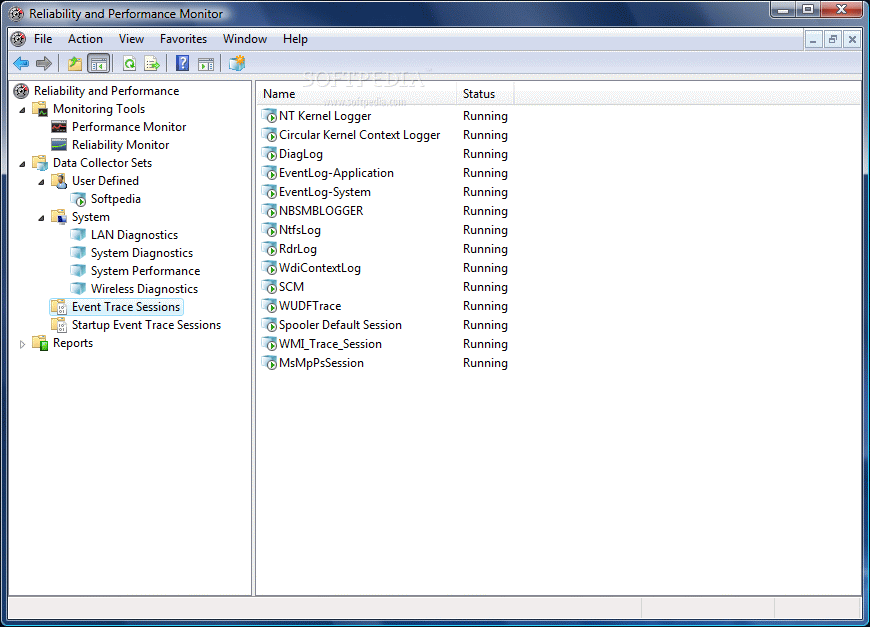
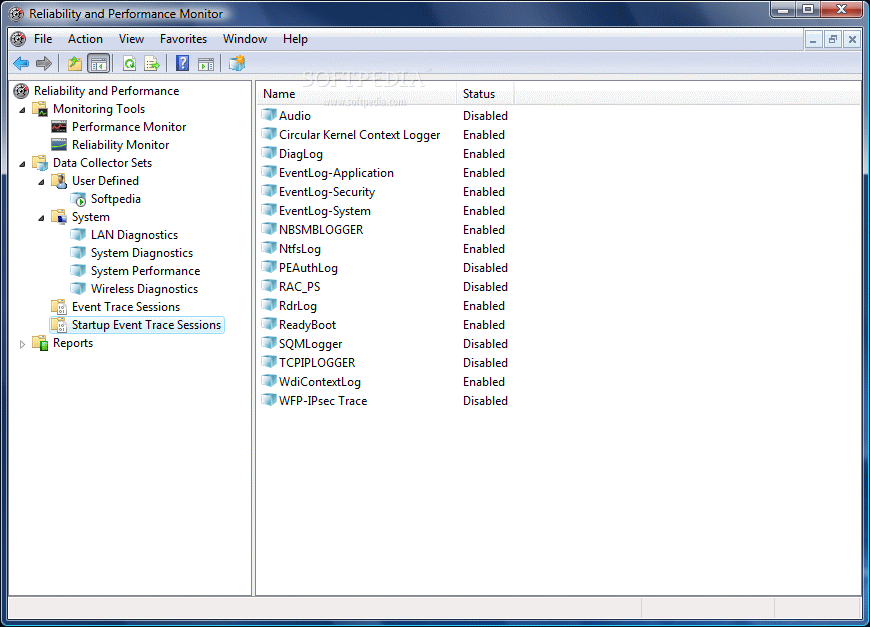
To gain access to this tool simply right click Computer and select "Manage" option. The Computer Management console will open and under System Tools you will find the Reliability and Performance Monitor. The sub-categories available divide in three sections: Monitoring Tools (for performance and reliability), Data Collector Sets and Reports.
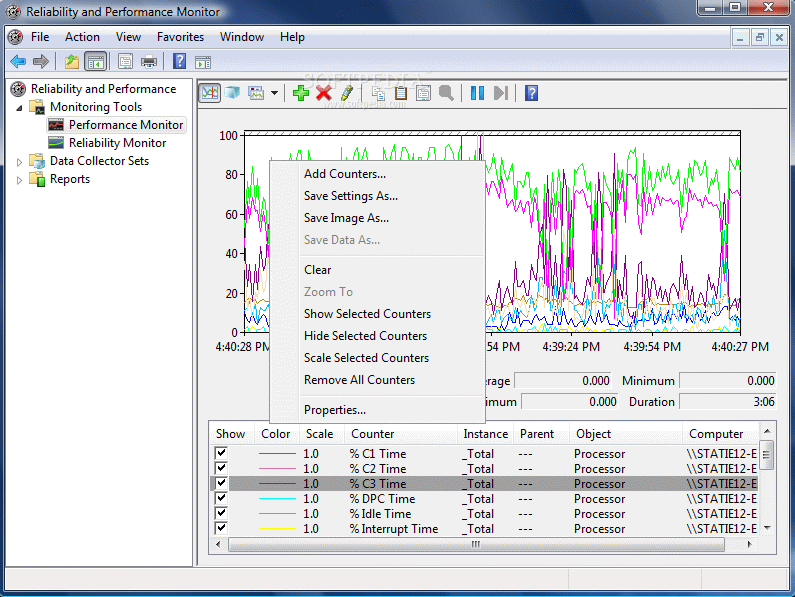
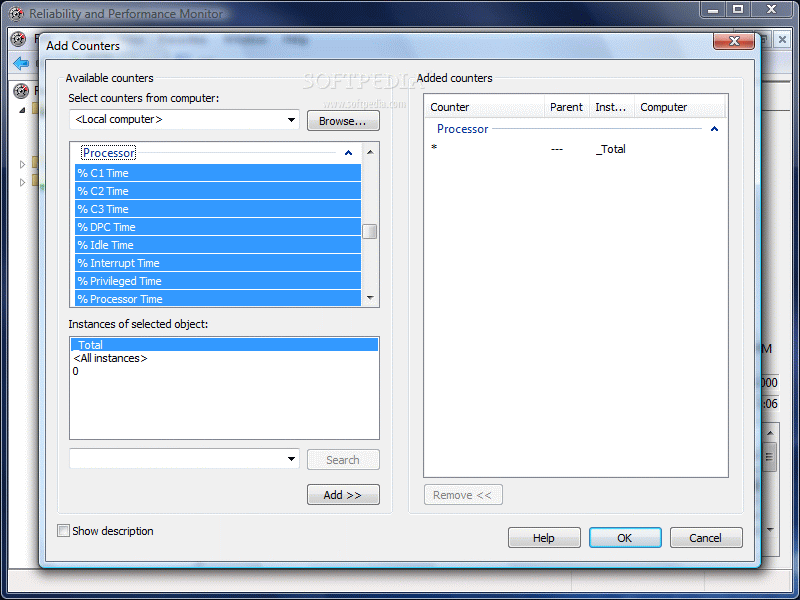
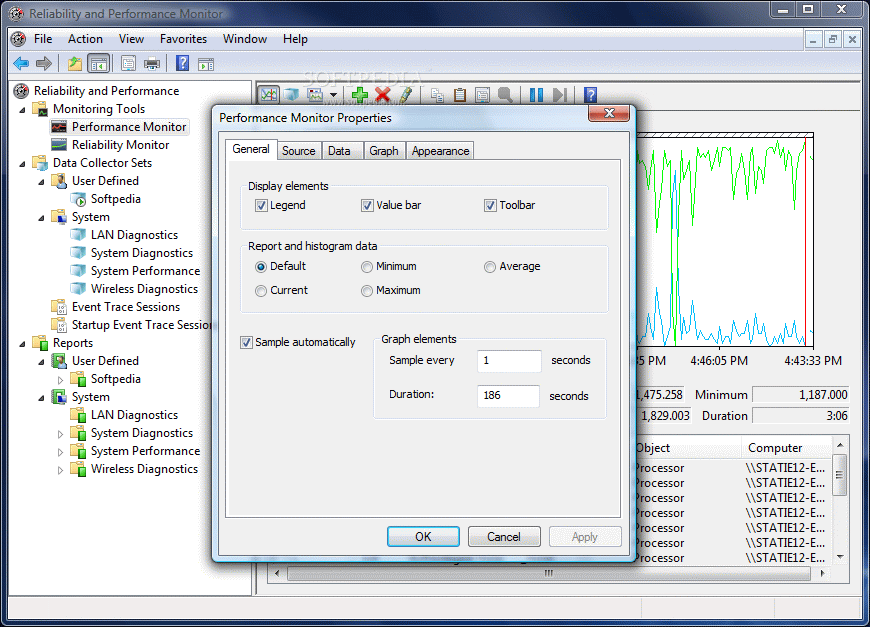
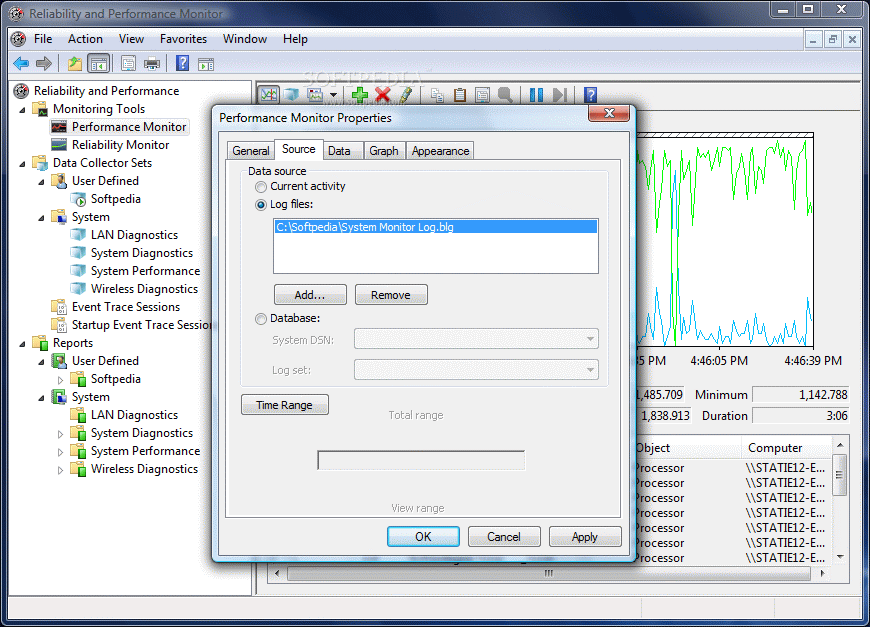
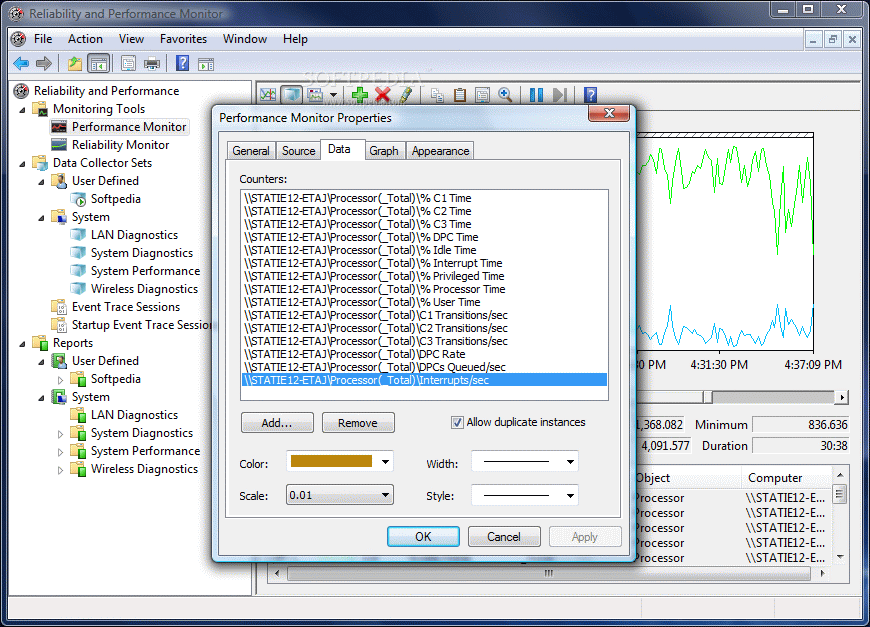
The Performance Monitor is a powerful tool for viewing performance data both from longs and in real time. You can analyze the data in a graph, histogram or report. All you have to do is add the data to be monitored by the application. Right click inside the window and choose "Add Counters". The application will take a moment to detect the counters available on the local computer.
The performance counters for the CPU are among the most important and the list is quite rich. The Performance Monitor will record the state of the Interrupt/Privileged/Processor/User Time, DPC Rate, Interrupts/sec, and many more.
Additional monitoring can be done for Search Gatherer, Search Indexer, Security per process Statistics or System-Wide Statistics, etc. The average user will not have too much to do in this section, but advanced users preoccupied about the state of the system or its activity will definitely use this tool from Vista.
In the real-time performance window you can customize the color of each counter and select only the ones you are interested in. To be frank, having all the processor counters available and shown does not make too much sense in the graph.
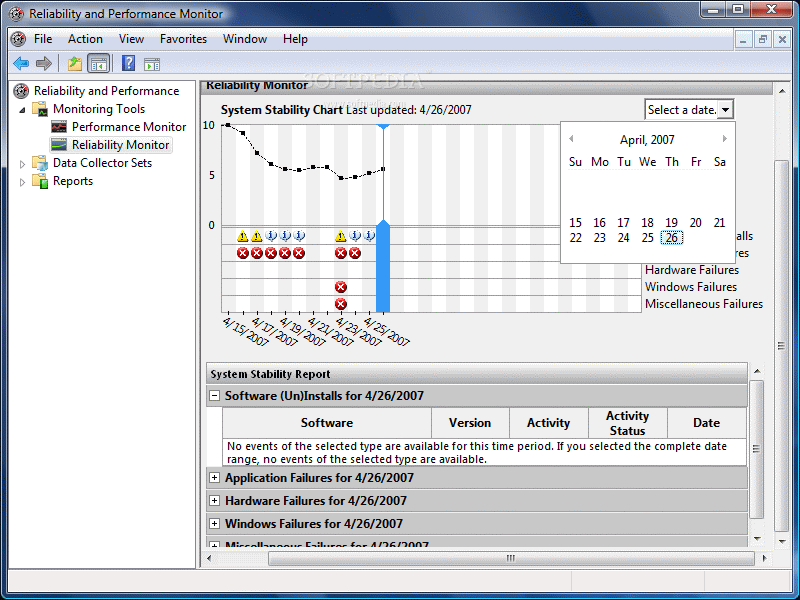
Reliability Monitor will be more to the taste of the majority of the users. It is a snap-in for MMC (Microsoft Management Console) and provides an overview of the system stability. The stability index at the right side of the chart will give you a hint on how stable your system is. It runs on a scale from 1 to 10. The lower the index, the more unstable is your system.
The instability of the operating system has many causes and as shown in the report sheet below the chart, software uninstalls, application failures, hardware failures, Windows failures and others are the main cause for system crashes or low performance.
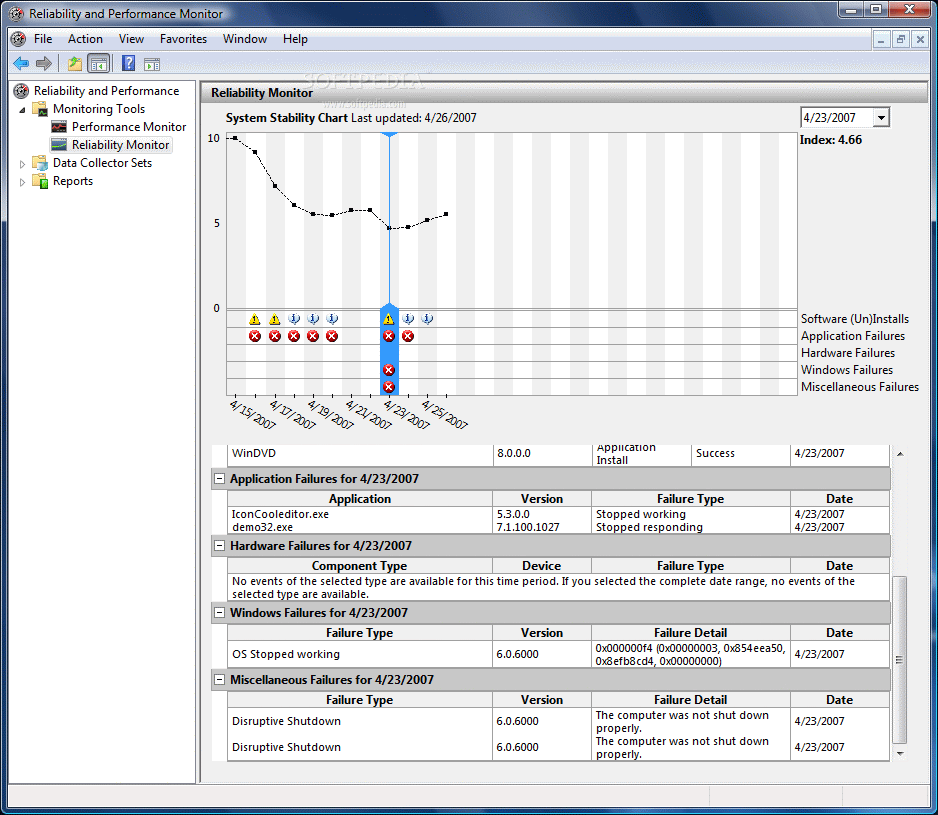
Each of these categories is expandable and you can see a detailed report on the events that affected the stability of your system. In Software (Un)Installs you will be provided with the name of the software, type of the activity, activity status and the date of the event. You can point to the dots in the graph to see the stability report for that day.
In Application Failures there are recorded the applications that stopped working or responding and the details of the event are the same as in Software (Un)Install.
If hardware components fail to assist you, it will also be present in the report as well as uncommon shut downs of your computer (resets, power failures, etc.).
Data Collector Sets is an inclusive report composed of performance monitoring and reporting components. It sums up everything into a single component that can be used to review the performance of your computer. You can define your own data collectors according to your needs. The process does not take long and the built-in wizard will assist you to the finish.
You can start creating one from a template or manually create one (for advanced users). For the first choice the user has to decide between one of the three templates of the collector sets: Basic (add/remove counters, scheduling options), System Diagnostics (reports the status of hardware resources, system response times and processes) and System Performance (used for identifying causes of performance issues).
Until you get more comfortable with using this utility I suggest using the beginner options available and recommended. This way you will be able to get a good grasp on the settings and features offered.
I suggest you check this tool every time something goes wrong with your computer: crashes, application failures, errors at uninstalling a software, etc. This way you can avoid instability by taking the necessary measures to fix the problem.