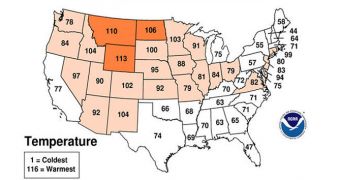
According to the new State of the Climate report released in the United States yesterday, November 8, last month was the 11th warmest October on record in the nation. Temperature were considerably higher than normal, while precipitation levels went slightly below average.
The report, which was released by the US National Oceanic and Atmospheric Administration (NOAA), shows that October 2010 had average temperatures of 56.9 degrees Fahrenheit, which is a level some 2.1 degrees above the 1901-2000 mean.
The average precipitation level for the month was 1.85 inches, which represents a slight decrease of 0.26 inches from last century's levels, the document shows.
It was additionally shown that average temperatures for the past three months (August to October) were in fact the fifth warmest on record ever. These findings are in tune with the idea that human-induced global warming is causing temperature levels to fluctuate from baseline levels.
The data NOAA uses to create its State of the Climate report series are collected via an extensive network of long-term weather stations, that are spread out around the United States.
One of the most interesting things to note here is that no areas in the US experienced lower-than-average temperature levels, as one would expect if the events were to be caused by natural variation.
Just two areas, along the country's East Coast, experienced average temperature levels. All others were warmer and less wet than average.
These reports are usually compiled by experts at the NOAA National Climatic Data Center (NCDC), in Asheville, N.C. They are a part of the Administration's official mission.
“NCDC’s State of the Climate reports, which assess the current state of the climate, are released soon after the end of each month. These analyses are based on preliminary data, which are subject to revision,” NOAA experts say.
“Additional quality control is applied to the data when late reports are received several weeks after the end of the month and as increased scientific methods improve NCDC’s processing algorithm,” they add.
As far as precipitations go, the new document shows, areas in the Plains, Ohio Valley and the South were drier than normal, whereas regions in the western and northwestern US experienced wetter-than-normal conditions.
“NCDC's Climate Extremes Index (CEI), which measures the prevalence of several types of climate extremes, was about nine points higher than its historical average for the year so far,” NOAA concludes.

 14 DAY TRIAL //