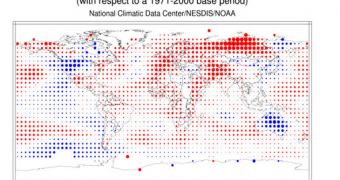
Experts with the US National Oceanic and Atmospheric Administration (NOAA) have just released new statistics, which indicate that the month of May, 2011, was the 10th warmest in recorded history.
Accurate data measurements began being kept around 1880, and meteorologists and researchers have been keeping a close eye on how global temperatures evolve ever since. Also in May, researchers found the third smallest sea-based ice extent in history.
Some believe that these readings can be attributed to the influence of the La Niña event, which concluded its 2011 cycle only recently. The couple ocean-atmosphere phenomenon is influencing climate patterns across the globe.
The newly-released report was compiled by the NOAA National Climatic Data Center (NCDC), under a mandate to provide the government, business and community leaders with the relevant data they need in order to make correct decisions.
The document indicates an average temperature of 59.50 degree Fahrenheit (15.30 degrees Celsius) for last month, a figure that is about 0.90°F (0.50°C) above the 20th century average of 58.6°F (14.8°C).
“Separately, the global land surface temperature was 1.31°F (0.73°C) above the 20th century average of 52.0°F (11.1°C), which was the seventh warmest May on record,” a NOAA press release details.
“The global ocean surface temperature was 0.74°F (0.41°C) above the 20th century average of 61.3°F (16.3°C), making it the 11th warmest May on record,” the statement goes on to add.
“The average Arctic sea ice extent during May was 5.96 percent below average, ranking as the third smallest May since satellite records began in 1979. The May 2011 Antarctic sea ice extent was 1.17 percent above average and was the 14th smallest May extent since 1979,” the document shows.
Throughout the Northern Hemisphere, snow covers were significantly diminished from their usual levels, highlighting the creeping influence of man-made global warming, and the climate change it produces. NOAA is carefully monitoring these aspects.
With dwindling sea ices and melting glaciers comes increased global sea levels, changing precipitation patterns, seasonal modifications and other such events. Understanding the correlations between them will help authorities remain prepared in facing the adversities ahead.

 14 DAY TRIAL //