The World Cup is over and Twitter can breathe a sigh of relief managing to survive the onslaught of tweets that were bringing the site to its knees. While there were issues throughout the tournament with availability, Twitter also managed to break quite a few activity records. And now that it’s all over it can even look back and enjoy them.
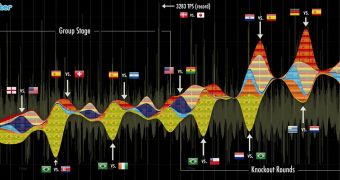
Twitter has released a data-packed infograph showing what people were tweeting about during the World Cup and how many times. The record for most tweets per second was smashed several times during the past month yet, surprisingly, the record was not set during the World Cup final.
“To highlight how much Twitter has been pulsing with World Cup activity over the past month, our analytics and relevance teams put together the infographic above, charting fans’ use of hashflags (like #esp or #usa) during the tournament with a background of TPS over the same period,” Twitter wrote.
“When you look at this graphic, think of it like a soundwave -- the louder and more consistent the ‘sound,’ the bigger the impact in all directions. Countries’ flags represent use of their hashflag. The size of the flag “waves” fluctuate with the frequency & consistency of tweets containing each country’s hashflag,” Twitter explained.
The World Cup Final between Spain and the Netherlands didn’t manage to get people as excited as other matches before that. With just one goal scored in overtime, the match’s dullness probably contributed to that. The peak number of tweets was reached when the goal was scored and it got to 3,051 tweets per second. An impressive figure, but below the 3,283 tweets per second seen at the end of Japan-Denmark. However, the final match managed to create the highest level of sustained traffic Twitter has ever seen, with over 2,000 tweets per second for the last 15 minutes of the game.

 14 DAY TRIAL //