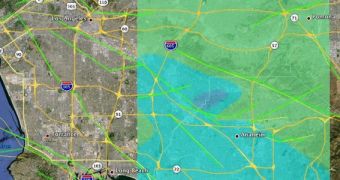
A team of experts at the NASA Jet Propulsion Laboratory (JPL) in Pasadena, California, have recently used data provided by the United States Geological Survey (USGS) to produce a model of the magnitude 5.1 earthquake that affected the Greater Los Angeles area on Friday, March 28.
This was the most important tremor to affect this region since 2008. The epicenter of the seismic event was located near La Habra, in Orange County, some 33 kilometers (21 miles) east-southeast of Los Angeles. Its effects and aftershocks reverberated throughout Southern California. The most significant aftershock registered with a magnitude of 4.1.
USGS assets in the area automatically recorded the distribution of all aftershocks, and compounded this information with other seismic data. JPL investigators then took this dataset and created a model of how the earthquake was produced, and how its effects were distributed in the area around the epicenter.
The end result achieved through this model is a representation of how the earthquake would have looked like if observed with an interferometric synthetic aperture radar. This class of instruments is represented at NASA by the Uninhabited Aerial Vehicle Synthetic Aperture Radar (UAVSAR) asset.
The UAVSAR did produce some data during the March 28 earthquake, and JPL scientists now plan to get a hold of this information as soon as possible. The data will be included in the model they have already developed, thus helping researchers gain a deeper understanding of what happened.
The event is believed to have been caused by a blind thrust fault called the Puente Hills Thrust fault, which is not visible on the surface. Faults of this class never break Earth's surface, and can be very difficult to detect without proper equipment. This particular one runs from Orange County to downtown Los Angeles.
In the past, it produced the Whittier Narrows earthquake, a magnitude 5.9 tremor that occurred on October 1, 1987. The event claimed 8 lives, injured hundreds, and caused hundreds of millions of dollars in property damage. According to an estimate produced by the new model, the fault line is 9 kilometers (5.6 miles) long, 3 kilometers (1.9 mile) wide, and 5 kilometers (3 miles) deep.
JPL investigators say that the fault segment included in their model runs downward at an angle of 60 degrees. The earthquake it produced on Friday was caused by a 10-centimeter (3.9-inch) slip in one side of the fault, which moved at a slanted angle horizontally with respect to the other side.
Earth's surface was displaced by about 1 centimeter (0.4 inches) following the seismic event. This is roughly the sensitivity threshold of the UAVSAR instrument, which flies aboard a NASA C20-A aircraft based at the Armstrong Flight Research Center, in California. The asset has a resolution of 0.1 to 0.5 centimeters (0.04 to 0.2 inches).

 14 DAY TRIAL //