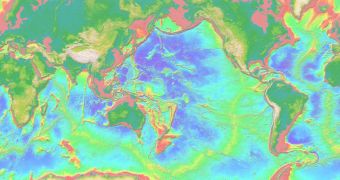
Two decades of hard work have finally paid off for a collaboration of researchers from the University of Wisconsin-Madison, the Rice University, and the NASA Jet Propulsion Laboratory (JPL). Geophysicist Chuck DeMets (UWM), alongside colleagues Richard Gordon (Rice) and Donald Argus (JPL), has managed to produce an image of the dynamic 3D puzzle that is the crust of our planet. The investigation has covered 25 tectonic plates in continuous interaction, and 97 percent of the planet's surface, the team says.
“This model can be used to predict the movement of one plate relative to any other plate on the Earth's surface. Plate tectonics describes almost everything about how the Earth's surface moves and deforms, but it's remarkably simple in a mathematical way,” the team leader says. “We live on a dynamic planet, and it's important to understand how the surface of the planet changes. The frequency and magnitude of earthquakes depend upon how the tectonic plates move. Understanding how plates move can help us understand surface processes like mountain-building and subsurface processes like mantle convection,” Gordon adds.
Though it appears extremely solid, the Earth's crust is in fact moving constantly atop the ocean of magma that is the planet's upper mantle. The crust is not made of a single piece, but out of a lot more, each of different sizes. There are a few impressively large tectonic plates, such as the one under the Pacific Ocean, the Eurasian one, the African one, and so on. There are, however, a myriad of smaller plates, each of them engaged in various collision or separation processes with their neighbors. Studying the interactions between these formations could give researchers some clues as to where the next earthquakes might hit, and which volcanoes may blow their tops off.
The newly published model has been named MORVEL, which stands for “mid-ocean ridge velocities.” It is currently available online, and will be published in print as well, in the April issue of the esteemed scientific publication Geophysical Journal International. The model's resolution and precision reach top peaks, considering that it is based on the most precise maps of the tectonic plates available, and that it incorporates data collected from numerous ground- and space-based observatories.
“Along the boundaries where plates meet there are lots of active faults. It's useful to know how quickly the plates are slipping across those faults because it gives you some feeling about how often large earthquakes might occur. The direction of movement across the faults gives some indication of whether plates are moving toward one another, which gives rise to one kind of faulting and seismic hazard, or slightly away from each other, which gives rise to another kind of faulting and a different type of seismic hazard,” DeMets says.

 14 DAY TRIAL //