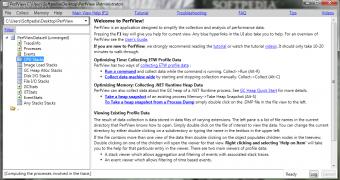
One of the latest utilities that Microsoft made available for download for Windows users is PerfView, a tool aimed at offering performance analysis capabilities for isolating CPU and memory issues.
Pushed out of Microsoft’s labs this week in version 1.0, the new PerfView tool can prove helpful in a variety of scenarios.
The application has been designed with focus on ETW information (ETL files), along with CLR memory information (heap dumps). Through it, ETL files and XPERF CSV files can be easily collected and viewed.
At the same time, the new application packs powerful grouping operators, which have been designed to provide users with the possibility to understand performance profiles in manners that other similar tools cannot.
Microsoft also notes that the application is already being used internally by a series of its teams, and that it is the main performance investigation tool that the .NET Runtime team takes advantage of.
Some of the main features of the new application include:
Memory Support for very large heaps (gigabytes) Snapshot diffing Dump files (.dmp)
CPU Performance
Support for managed, native, and mixed code Can read XPerf logs Profile diffing
PerfView also comes with non-invasive collection, which makes it suitable for being used in live, production environments.
The application was designed with support for Windows 7, Windows Server 2008, Windows Server 2008 R2, and Windows Vista operating system. It requires .NET Framework versions 2.0 or above to work.
To take advantage of the application, users will not need to run a setup. It features Xcopy deployment, which means that users will simply have to copy the content of the zip to a folder, and run the executable. You can download PerfView 1.0 from Softpedia via this link.
Further info on what the application can deliver, and what usage scenarios it is suitable for, can be found under "Help | User's Guide" in PerfView.

 14 DAY TRIAL //