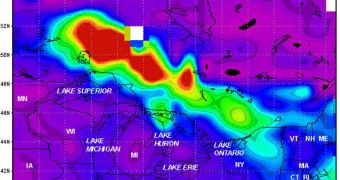
Fires raging on in Ontario, Canada, are producing vast amounts of pollution, experts say, and this pollution is currently making the 1,000-mile trip separating it from Niagara Falls. The NASA Aqua satellite is monitoring how the situation is progressing.
In 2011 alone, more than 300,000 hectares burned due to wildfires in Ontario alone. For the week of July 17, the area accounted for more than 40 percent of all fires in the entire country. This should give you a scale of the devastation
According to the Canadian Interagency Forest Fire Center (CIFFC), the situation is likely to get worse before its gets better. Officials here are urging other agencies, both in Canada and the United States, to continuously monitor the situation.
By the end of last week, smoke from fires in Ontario managed to reach Nova Scotia and Newfoundland. As this happened, the NASA Aqua and Terra satellites were on station to provide cover.
The Moderate Resolution Imaging Spectroradiometer (MODIS) instrument – which flies on both satellites – was essential for the monitoring effort. It can keep track of pollution with relative ease, making it easier for the American space agency to chip in.
Aqua's MODIS passed over the western parts of Ontaroi on July 18 at 17:58 UTC (1:58 pm EDT). The instrument managed to collect a detailed, visible-light image of the brown smoke being emitted by the fire. It also found the heat signature of hot spots, areas where fires are still burning.
These satellite instruments can also measure something called the Aerosol Optical Depth (AOD). This is similar to analyzing concentrations to particles underneath the ocean surface, from above. The only difference is that the atmosphere is MODIS' ocean.
Aerosols are either solid or liquid particles that play a very important role in determining how much sunlight in absorbed by the planet and how much is reflected, if and when clouds will form and so on.
“One of the advantages of Giovanni is that it allows us to make rapid multi-day averages of daily data from MODIS,” Dr. James Acker explains. Giovani is an online application that can help centralize satellite data, and draw conclusions from raw observations.
“By averaging the data, we can see the full extent of smoke from the fires, which can be a health hazard. The AOD data also clearly indicates where the smoke is, and distinguishes it from weather clouds,” he goes on to say.
Acker holds an appointment as an oceanographer at the NASA Goddard Space Flight Center (GSFC) Earth Sciences Data and Information Services Center (GES DISC). He is creating a Giovanni data portal specifically for educators.

 14 DAY TRIAL //