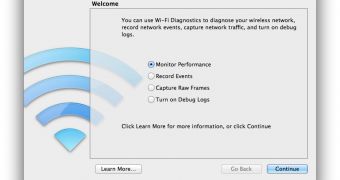
A ‘hidden’ application in OS X Lion allows you to diagnose your wireless network, record network events, capture network traffic, and turn on debug logs.
Apple has included in OS X Lion an application that allows you to monitor and diagnose your Wi-Fi connection with four major options to monitor performance, record events, capture raw frames, and turn on debug logs.
Apparently first noticed by a company that provides Mac data recovery and disk utility software, SubRosaSoft.com Inc., Apple’s Wi-Fi Diagnostics app is hidden in the CoreServices folder in the main System directory of the administrator’s hard drive.
Here’s your path:
Open hard drive: /System/Library/CoreServices/Wi-Fi Diagnostics.app
Monitor Performance comprises a graph that lists network signal strength, noise level, transmit power, and data rate.
This segment of the WiFi Diagnostics app records Country Code, SSID, Channel, txPower, txRate, Signal, and Noise and logs the information for exportation in .plst format or via email.
The Record Events section reports dropped network connections, roaming, as well as the computer’s activity when connecting or disconnecting to and from a network or network device. This option also allows for log exportation.
Capture Raw Frames lets you captures all network traffic on the Wi-Fi interface, including data sent and received on the network, data sent and received on the computer, and data from all nearby networks.
Here, users also have the option to “disconnect from the network and capture only data from channel,” with an option to select said channel.
Finally, the Debug Log section provides specific details of every wireless connection. This includes any event, meaning this log will be the most thorough of them all.
Have you found anything new in OS X Lion that you’d like to share with the world. Hit us with an email, or share a story in the comments.

 14 DAY TRIAL //