14 DAY TRIAL //
 While moving from Internet Explorer 7 to Internet Explorer 8, the Beta 1 release of the browser made available last week, for the general public, features an almost exclusive under-the-hood evolution. With just a small part of the changes reverberating to the surface, end users are last in line to get a dedicated release. The first Beta of Internet Explorer 8 brings to the table what Microsoft referred to as essentially a build for developers. The Redmond company's focus is by no means misplaced, as web developers have to ensure that their content is tailored on IE8. In this context, IE8 Beta 1 also delivers integrated Developer Tools to streamline the work associated with adapting web content with Internet Explorer 8.
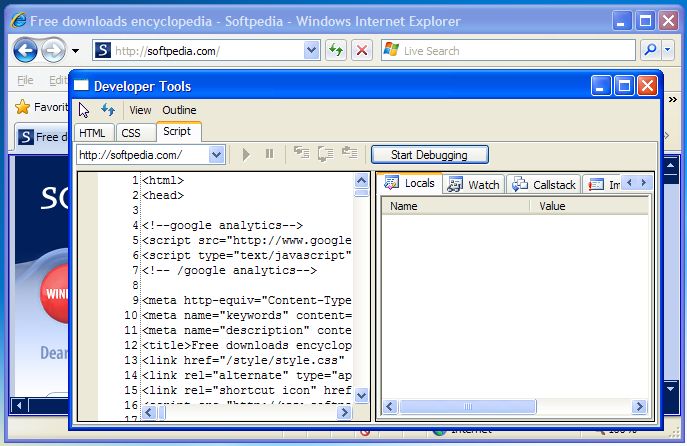
"Internet Explorer 8 simplifies the process of debugging by including developer tools out of the box and making those tools easy to use. Instead of having to find, download, and install a separate debugging application, just press SHIFT+F12, or click the developer tools icon in the command bar. And if you want to debug JScript, switch to the script tab and press ?Start Debugging?. Even if script debugging is disabled, Internet Explorer 8 will remind you that it will refresh the page and enable debugging for only the current IE instance so you won?t see script error dialogs as you browse the web. Or, if you prefer to avoid the page refresh and dialog, just enable script debugging for Internet Explorer in the ?Advanced? tab of the Internet Options Control Panel," stated John Hrvatin, IE Program Manager.
The IE Developer Toolbar is by no means a new solution, having originally been released in May 2007, and you will notice evident similarities with the IE8 Beta 1 Developer Tools. This is because Microsoft implemented changes into the IE8 Beta 1 Developer Tools following the feedback received with the IE Developer Toolbar. According to Hrvatin, the original toolbar input was focused on performance depreciation. Developers that will start to play around with the new tools shipping with IE8 Beta 1 will notice that some of the features of the original toolbar have survived, while others are not present. Still, Hrvatin did point out that new features will be added as IE8 moves onward in the development process.
"In addition to simplifying the debugging process, IE8 Developer Tools offer a new perspective on your site. Instead of just a source view, the tool provides visibility into Internet Explorer?s internal representation of the site. For example, the DOM tree in the tool is built from the tree IE builds internally to display the page, not from your source. So if script changes the tree, IE8 shows you the updated tree. You can also view style information for an element to better understand what rules apply or what rules specify a given style property," Hrvatin added.
The IE8 Developer Tools whitepaper can be accessed here. And Microsoft is also offering video of Developer Tools Overview as well as Developer Tools Debugging. Internet Explorer 8 Beta 1 is available for download here.