Galaxies that formed only one billion years after the Big Bang reveal that the presence of dark matter is essential in constructing a new model of the universe. Computer simulations of the interaction between ordinary and dark matter expose violent but rather critical interactions, which are mostly being ignored in the current model of the universe evolution.
Unlike the previous theory, the Cold Dark Matter cosmology can be successfully used to explain processes on the largest scale, such as those that act on distances larger than a few million light years. However, it is still unable to explain some of the predictions regarding the internal properties of the galaxies, like the problem presented by the presence of dark matter thought to represent most of the mass of the galaxies.
According to Sergey Mashchenko, an associate of the Department of Physics and Astronomy at McMaster University, the computer simulations of these cosmological events can solve the problem by modeling the violent processes that take place inside a galaxy during its birth, as impressive amounts of gas collapse to form massive stars that eventually die by blowing up like supernovae.
The shock of these explosions moves the mass of interstellar dust and gas back and forth in the core of the galaxy, similar to the wave action inside a bathtub, ejecting most of the mass of dark energy out from the center of the galaxy.
The previous theories regarding the forming of galaxies greatly regards the role of the interstellar gas and its effect on the dark matter.
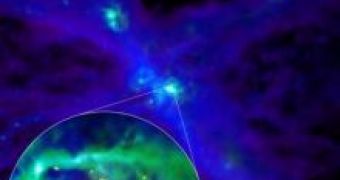
In the image above you can see such a dwarf galaxy in the process of forming only one billion years after the Big Bang. The image in the background represents the large scale picture, approximated at more than 100,000 light years across, while the image in the insert represents the central region of the galaxy, only 2,000 light years across, which shows how the star formation process influences the bodies of interstellar gas. The stars are visible in the image in yellow, while the violet and green represent the variations in the cloud density.

 14 DAY TRIAL //