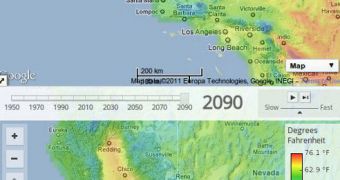
Researchers from the University of California in Berkeley (UCB) have recently put up a new public website, which can be used to access a host of data related to global warming and climate change.
The online tool - which can be accessed here - also provides forecasts into how Earth's climate will look like in the future. The simulations are based on projections and approximations made using the available information.
California universities and research centers have been conducting climate change-related investigations for many years, and experts working here have collected vast volumes of data in the process.
Now, all of that information has been centralized into an accessible, comprehensive online tool, which is bound to suffer modifications for the better as soon as users start to provide feedback.
The California Energy Commission (CEC) and the California Natural Resources Agency (CNRA) are the state agencies that supported this project, officials announced on Tuesday, June 7, when the new website was launched.
The CEC Public Interest Energy Research (PIER) program has supported countless, peer-reviewed climate change researches over the years, and the online tool is just one of the ways in which the data are brought back to the public.
“PIER-funded projects have produced enormous amounts of data and findings related to climate change and its impact on California, but until now the data from the research has been inaccessible to a larger audience,” Kevin Koy explains.
He holds an appointment as the manager of the Geospatial Innovation Facility (GIF), a state-of-the-art mapping and geolocation center located at the UCB College of Natural Resources.
The Cal-Adapt website was developed at this location, the GIF team announced earlier this week, in an article published in the journal Photogrammetric Engineering & Remote Sensing. Koy was one of the coauthors of the new work.
Benefiting local climate adaptation efforts is one of the main goals of this tool. Authorities, scientists and laymen alike can use it, due to the fact that it's very easy to understand, and that the data it contains are valid.
“This feature and others like it are what make interactive Web-based maps the ideal platform to explore large, complex, location-based information,” Koy says.
“Users can quickly see many options related to a particular subject. For instance, a user can view average annual temperature projections across the state, and then update the data to display only annual temperature averages for Lake Tahoe, then June Lake Tahoe averages, and then December Tahoe averages,” he adds.
“Given the state’s many microclimates, each user can take away something completely different from the site, and there are almost limitless combinations to explore,” the expert concludes.

 14 DAY TRIAL //