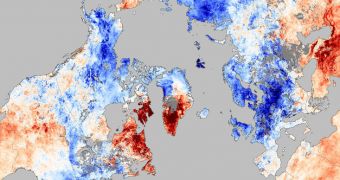
In a temperature map released by the American space agency, the pattern of influences caused by the Arctic Oscillation becomes clearly visible. Cooling is recorded for Northern Europe and Eastern America, while Northern Canada and Greenland are a lot warmer than usual.
The conclusions were derived from the attached map, which reveals average temperature levels for the week December 3-10. Throughout this interval, parts of Europe and the United States were a lot cooler than the average level for this time of the year.
On the other hand, a similar, but opposite variation was recorded in Greenland and parts of Canada, which have been a lot warmer than normal. According to experts, these variations are caused by the Arctic Oscillation, which is a natural phenomenon.
The AO can be defined as an index of the dominant pattern of non-seasonal sea-level pressure variations north of 20 degrees North latitude. Its main traits are pressure anomalies of in the Arctic with the opposite anomalies centered around 37-45 degrees North latitude,
NASA experts say that the measurements which enabled them to create this temperature map were colelcted using the Moderate Resolution Imaging Spectroradiometer (MODIS) instrument, which is based on the agency's Aqua satellite.
The amount of positive or negative temperature variation was determined by comparison to average levels recorded by similar instruments between 2002 and 2009, the team behind the work says.
One of the main reasons the phenomenon took place is the influence of the AO climate pattern, which is among the most important factors determining winter weather in the northern hemisphere.
“When the pressure systems are weak, the difference between them is small, and air from the Arctic flows south, while warmer air seeps north,” NASA says in a press release presenting the map.
“This is referred to as a negative Arctic Oscillation. Like December 2009, the Arctic Oscillation was negative in early December 2010,” the statement adds.
“Cold air from the Arctic channeled south around a blocking system over Greenland, while Greenland and northern Canada heated up,” it goes on to say.
AO patterns are themselves influenced by the condition of the Arctic, which is currently changing on account of global warming. Polar regions are the most sensitive regions in the world when it comes to temperature swings, climatologists explains.
Similar variations are expected to take place over coming years as well, given that governments decided not to purse a course that would mitigate the effects of climate change.
The Cancun UN Climate Summit produced a weak, non-legally-binding agreement that set the world on a path which will see temperatures rise by 3.2 degrees Celsius globally. The rise needs to be maintained below 2 degrees Celsius, if devastating effects are to be averted.

 14 DAY TRIAL //