14 DAY TRIAL //
 A map of the Earth represents the height of the terrain in each point. But imagine a map of a different kind: instead of representing the height of the terrain we could represent the temperature in each place. This map of temperatures would obviously change continuously much faster than the terrain maps. We could nonetheless ease the changes a little bit by taking time averages - representing the average temperature during, say, one year. Besides the time average, we can also employ a space average - instead or representing the temperature in each point we could take the average temperature on, say, each square meter or square kilometer. Such an averaged map in both space and time would allow us to see beyond the random fluctuations of temperature and see the overall trends more clearly. (This "blur" method is also one way of getting the noise out of sound files or of pictures.)
At the same latitude this temperature map is lower above oceans and even lower above mountain tops than it is above plains. As one goes from the equator to the poles it gets lower, on the average. The map is also higher above cities than above rural areas. Above oceans the map is not homogenous. For instance, in the Pacific Ocean the map is higher near the Asian coast than it is near the American coast at the same latitude. So, it has quite an interesting landscape.
How would such a temperature map vary in time?
There are two types of variation: The first kind involves the entire map - the average temperature of the entire Earth may rise or fall. This can happen because of changes in the Sun activity, because of small variations of Earth's orbit (variations that take us a little bit closer of further away from the Sun), or because internal factors on Earth.
The most important internal factors include the Earth's albedo - how much sunlight the Earth's atmosphere reflects back into space - an effect that depends on the composition of the atmosphere particularly that of the clouds; the greenhouse effect - how much of Earth's energy (acquired from the Sun or internally produced, naturally or artificially) is trapped from being emitted into space as infrared light - an effect that is caused by gases such as water vapors, carbon dioxide and methane; and, to a smaller degree, the oceans capacity of trapping heat.
The second kind of variation can happen while the average temperature of the entire Earth remains constant. These variations from place to place are caused by heat transfer from one part of the Earth to another part.
"As an analogy, think of your bath tub and the types of change to the water level you can get there. A change of the first kind would be a change in mean level, e.g. if you add water. A change of the second kind would be the changes you get by sloshing around the water in the tub," explained the Potsdam University's oceanographer Stefan Rahmstorf at RealClimate. "Changes of the second kind are due to changes in heat transport in the atmosphere or ocean, and these can occur very fast and cause large regional change. Think of your tub: if you want 10 cm higher water level at one end, you can achieve this by turning on the tap - but you can get there much faster by pushing some water over there with your hand, albeit temporarily and at the expense of the water level at the other end."
Because water has a large "heat capacity" compared to air - i.e. you need a lot of energy to change the temperature of water by one degree compared to how much energy you need for changing the temperature of air by one degree - the heat transfers from place to place on Earth are mainly mediated by ocean currents (although winds are obviously also a factor). While it is hard to heat an area of the ocean, once it is heated it retains its temperature for quite a long time - sufficiently long to act as a transporter of heat to a different part of the Earth. For example Western Europe's climate is relatively mild due to the warm current in the Atlantic Ocean.
Temperature wobbles during the Ice Ages
Scientists that have extracted and analyzed ice cores both from Greenland and from Antarctica have now showed that during Ice Ages the temperatures at the opposite poles oscillated in concert: when one temperature was high the other one was low and vice-versa. The period of one oscillation was about 1500 years. These abrupt shifts are called Dansgaard-Oeschger events, or DO events, and the climate models predict their occurrence.
"Temperatures in Greenland jumped up by more than 10 ?C within a few decades at the beginning of DO events, typically remaining warm for several centuries after," Rahmstorf said. "This happened over twenty times during the last great Ice Age, between about 100,000 and 10,000 years before present."
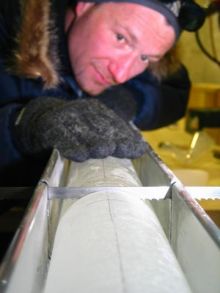
The European Project for Ice Coring in Antarctica (EPICA) is a joint effort of scientists from 10 European states. They have deduced the changes in temperature from the methane concentrations obtained from trapped air bubbles in the ice. The Antarctic ice core analyses were performed on the new EDML (EPICA Dronning Maude Land) ice core which allows the reconstruction of higher resolution atmospheric and climate records than previous ice cores from the East Antarctic plateau.
This was necessary for a precise synchronisation with the Greenland data. The Greenland ice core analyses were performed on the North Greenland Ice core Project (NGRIP).
Rahmstorf underlined how precise the measurements must be: "If one makes an error of only 5% in determining the age of an ice layer, for 40,000-year-old ice that's an error of 2,000 years. But to understand the mechanisms of climatic changes, one needs to know the sequence of events - for example, one needs to know whether a particular warming in Antarctica happens before, after, or at the same time as a warming in Greenland."
Based on the new synchronized time scale the scientists were able to compare the records from north and south and obtain an amazing proof of how Earth's temperature map waved from north to south while the overall global average temperature remained constant. (Read more.)
"It is really astounding how systematic this process worked also for smaller temperature changes in the Antarctic. Our data shows that the degree of warming in the South is linearly related to the duration of cold periods in the North Atlantic," said paleoclimatologist and corresponding author of the study Dr. Hubertus Fischer from the Alfred-Wegener Institute for Polar and Marine Research (AWI) in Bremerhaven.
The correlation between the temperatures in the two polar regions was probably due to the oceans, but the exact mechanism isn't yet clear. The mechanism might involve changes in the ocean currents, for example the Atlantic current bringing warm water all the way to Greenland. Another suggestion is that the DO events switch on and off the so-called thermohaline circulation in the Atlantic Ocean which involves the vertical motion of water from the surface to the depth.
In the last 11000 years, since the end of the last Ice Age, these cycles have no longer appeared as they have been swamped by the overall increase in global temperature. According to Rahmstorf it might even be impossible for such oscillations to take place in the current state of warming because of how the currents in the Nordic Seas are.
Nonetheless, these studies are still relevant for the present day, because they reveal that temperature changes also oscillate from place to place and not only in time. In general, the global change in temperature (in our case global warming) is superimposed by this second kind of change from place to place. Due to this fact studies on climate change have to gather information from many places around the world - a certain change in one place does not imply that the whole global climate is changing in the same way. (Many arguments brought about by global warming skeptics are wrong due to this reason.) Moreover, this implies that not all the regions in the world are affected in the same way by the climate change. Some regions can even experience opposite kinds of change - e.g. some regions might experience increased precipitations while others increased droughts.