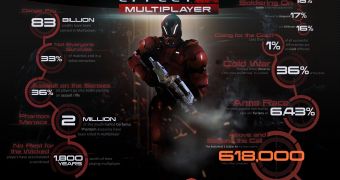
BioWare has just released the first statistics about the multiplayer mode in Mass Effect 3, highlighting the performances of players and sharing some interesting data about their effectiveness in the Galaxy at War mode.
Among Mass Effect 3's most controversial features there is the multiplayer mode, in which players are part of a team that needs to go on different planets and eliminate enemy factions like Cerberus, Geth or Reapers.
We were more than impressed with the online mode, as you could tell from the game's review, and now BioWare has shared the first stats about the multiplayer, including some impressive numbers about the performances of the Mass Effect 3 owners who tried it out.
According to the company:
- 83 billion credits have been earned in multiplayer - 33% of matches end with a failed extraction - 36% of players go into battle with an assault rifle - 2 million of the much feared Cerberus Phantom assassins have been killed in multiplayer - Players have accumulated a combined 1,800 years worth of time playing multiplayer - The Soldier class is the most popular, accounting for 18%, followed by the Vanguard, at 17%, and Infiltrator, at 16%. - Less than 1% of all successful multiplayer matches are on Gold difficulty - Firebase White (Noveria) is the most played map, accounting for 36% of all multiplayer matches - The most popular non-human race is the Turian, at 6.43% - The Battlefield 3 Soldier kit (an appearance option given to those who already have Battlefield 3) has been used in 618,000 matches.
As you can see, Mass Effect 3's multiplayer mode is quite a hit, although it's a bit peculiar that BioWare didn't share exactly how many matches were recorded up until now.
Either way, it's great to see that the Galaxy at War mode is so popular and hopefully this will convince BioWare to release some more content for the multiplayer, like new maps, weapons or enemy factions.
Check out the full infographic with the aforementioned data by viewing the main image of the article.

 14 DAY TRIAL //