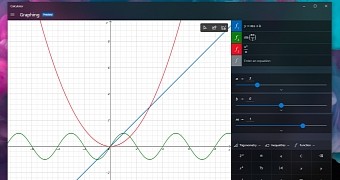
Microsoft has recently announced that the Windows 10 Calculator app would be getting a graphing mode, and users enrolled in the Windows Insider program can give it a spin by installing Windows 10 preview build 19546.
The graphing mode has been one of the top feature requests published in the Feedback Hub, Microsoft says, and will become available to all users with the release of Windows 10 version 2004 (currently codenamed 20H1 and due in the spring of this year).
“Adding support for graphing is one of our top feature requests in Feedback Hub, and we’re excited to bring this feature to our users. Graphing capabilities are also essential for students who are beginning to explore linear algebra. With this feature, we hope to empower students to learn mathematics by improving their conceptual understanding and attitudes towards math,” Brandon LeBlanc, Senior Program Manager, Windows Insider Program, explains.
New Calculator features
Beginning with this update, you can plot one or more equations on the graph for easier comparison. Additional options to customize the line style and graph viewing window are also offered.
Additionally, the new graphing mode also supports equations with variables, Microsoft says.
“If you enter an equation with a secondary variable (e.g., “y = mx + b”), you’ll be able to easily manipulate those variables so that you can quickly understand how changes to the equation affect the graph,” LeBlanc explains.
And of course, you can analyze the graph by tracing plots with either the mouse or the keyboard.
The new graphing mode overall isn’t only handy, but also pretty straightforward, so it’s easy to figure out how everything works. All users will be able to try it out later this year after the public rollout to production devices of Windows 10 version 2004 kicks off. As per the typical release schedule, this should happen in April or May.

 14 DAY TRIAL //