14 DAY TRIAL //
 Mountain View-based Internet giant Google has just released new stats regarding the distribution of the various Android versions among handsets and tablets available for purchase around the world.
Among the different flavors of the operating system, the Android 2.2 Froyo platform version is at the top, being present on 61.3 percent of all Android devices out there.
The report is based on data collected during the two weeks ending on March 15, 2011. It records the number of devices that accessed the Android Market in that time frame.
Next in line comes Android 2.1, which accounts for 29 percent of devices, followed by Android 1.6 and Android 1.5 with 4.8 percent and 3.0 percent, respectively.
The Android 2.2 iteration is now present on more devices than in the beginning of February, when it accounted for 57.6 percent of all active Androids on the market.
Android 2.1 went down from the 31.4 percent of Android devices it accounted for during the two weeks ended February 2nd, 2011.
As for Android 1.6 and Android 1.5, they lost market share as well, down from the 6.3 percent and 3.9 percent of the total number of Android devices they were present on in the beginning of the last month.
In all fairness, this does not come too much as a surprise, nor does the fact that newer OS flavors, including Android 2.3 and Android 3.0, are also present on the latest charts from Google.
Android 2.3 accounts for 0.7 percent of all active Android devices on the market, while Android 3.0 for 0.2 percent.
There is also the Android 2.3.3 platform version, which might replace Android 2.3 soon, and which accounts for 1.0 percent of all Android devices out there.
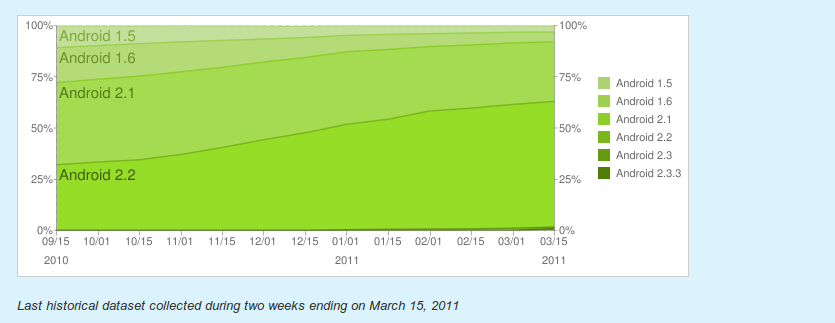
To make a better idea on the Android platform distribution, you should have a look at the charts that Google made available via its Android Developer website.
They are mainly aimed at offering developers an overview on the usage of various platform releases, so that they would know on which of them to focus with their applications.
“The following stacked line graph provides a history of the relative number of active Android devices running different versions of the Android platform. It also provides a valuable perspective of how many devices your application is compatible with, based on the platform version,” the company explains.