The iPhone is generally referred to as the best-selling smartphone in the whole world, and although there'll always be someone out there ready to prove this statement is wrong, statistics always come in handy to find out the truth.
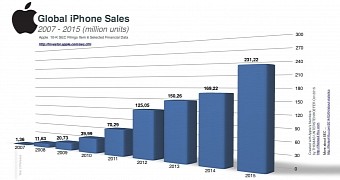
A graph put together by iNotes4You shows how the iPhone has evolved from an innovative device back in 2007, when the 2G version came out, to a worldwide sensation in 2015, when hundreds of millions of units are sold.
The data used in this chart is 100 percent accurate because it includes the figures that Apple has actually mentioned in its Securities and Exchange Commission filings since the iPhone came out.
Slow growth at first, huge boom afterwards
As you can see for yourselves, the iPhone debuted in 2007 with sales of just 1.36 million units, but at that time, the term smartphone was still very odd for pretty much everyone. Sales grew up by 10x the next year, when Apple launched the iPhone 3G, reaching 11.63 million and growing to 20.73 million in 2009, when the 3GS version came out.
And the growth continued over the years to eventually reach 169 million in 2014, when Apple officially launched the iPhone 6 and 6 Plus, with the latter becoming the biggest iPhone in the company's history.
And yet, this project proved to be very successful because the growth didn't stop there but continued to eventually reach 231 million units in 2015. Improved versions of the device, the iPhone 6s and iPhone 6s Plus, came out this year.
And Apple's still looking to expand the iPhone lineup with new models, with pundits now claiming that a smaller version, possibly with a 4-inch screen, is already in the works and expected to debut with the upcoming iPhone 7 series. Details are very vague right now, but such a project only makes sense if Apple's looking to tackle anything else than the high-end device market.

 14 DAY TRIAL //