The geology of the global ocean floor was last properly documented about 40 years ago, in the 1970s, when, based on samples collected from various locations, scientists produced a hand-drawn map revealing the distribution of sediments across the world's major bodies of water.
The thing is that, what with seas and oceans covering about 70% of our planet's surface and influencing both climate patterns and weather events, relying on a decades-old map when discussing their hidden geology just didn't cut it.
Earth sciences were in need of a sturdier leg to stand on, and thanks to a team of researchers at the University of Sydney in New South Wales, Australia, they got it.
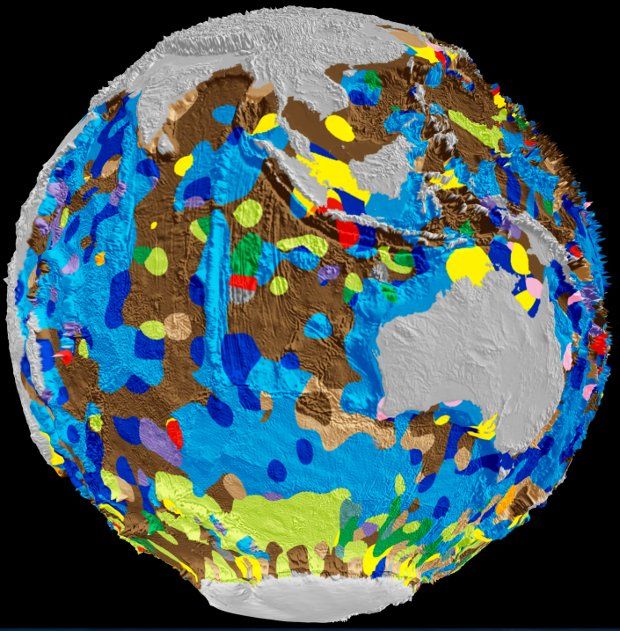
Based on an analysis of around 15,000 samples collected over more than half a century, University of Sydney scientist Adriana Dutkiewicz and colleagues have produced the first ever digital map revealing the geology of the planetary ocean floor.
This first-of-its-kind map, described in a recent issue of the science journal Geology, details the composition of sediments at the bottom of global seas and oceans. Both the map and the data it is based on are available as open-access resources.
What use is such a map?
Sifting through 50 years' worth of data on the composition of the global ocean floor and then piecing together all the information to make an interactive map wasn't easy, but the University of Sydney researchers don't regret the endeavor.
The scientists argue that this map of theirs that documents the floor geology of planetary seas and oceans is a sure way to better understand how these bodies of water responded to climate change in the past and determine how ongoing climate shifts will again alter them.
“Knowing the patterns of distribution of sediments in the global ocean is critical for understanding biogeochemical cycles and how deep-sea deposits respond to environmental change at the sea surface,” reads the researchers' report in the journal Geology.
“In order to understand environmental change in the oceans we need to better understand what is preserved in the geological record in the seabed,” lead researcher Adriana Dutkiewicz further stresses.
As for why the old hand-drawn map had to be replaced with a new, digital interactive version, it wasn't just because it wasn't detailed enough, the University of Sydney scientists say. Au contraire, the trouble with it was it was full of inconsistencies and, therefore, not reliable.

 14 DAY TRIAL //

