14 DAY TRIAL //
 Windows Vista is old news. I know that as well as anyone else. And yet there hasn't been enough talk about what it truly offers. I mean those underneath the great looking surface details that are so important. I know it fails to deliver your expectations every now and then; I also confront with "connectile dysfunction" at least four times a week (it depends on the computer restarts) but I always insist on sending Microsoft the report on the situation.
There is a known fact that in some cases Vista successfully manages to break your crayons (if not constantly as in my case, at least from time to time). And yet there is a bright side to the matter, a very bright one.
Task Manager suffered some changes and evolved into a very handy tool that gets closer to third party alternatives on the market. It has been fit out with a Services section which gives you a hint on the activity going on in the background and which definitely affects the way your system works. Besides this, a new tool has been added in the least expected location: Performance. At a first glance, there is not much changed in there except for adding the Up Time and Page File values and the change in displaying the sizes (from kilobytes to megabytes).
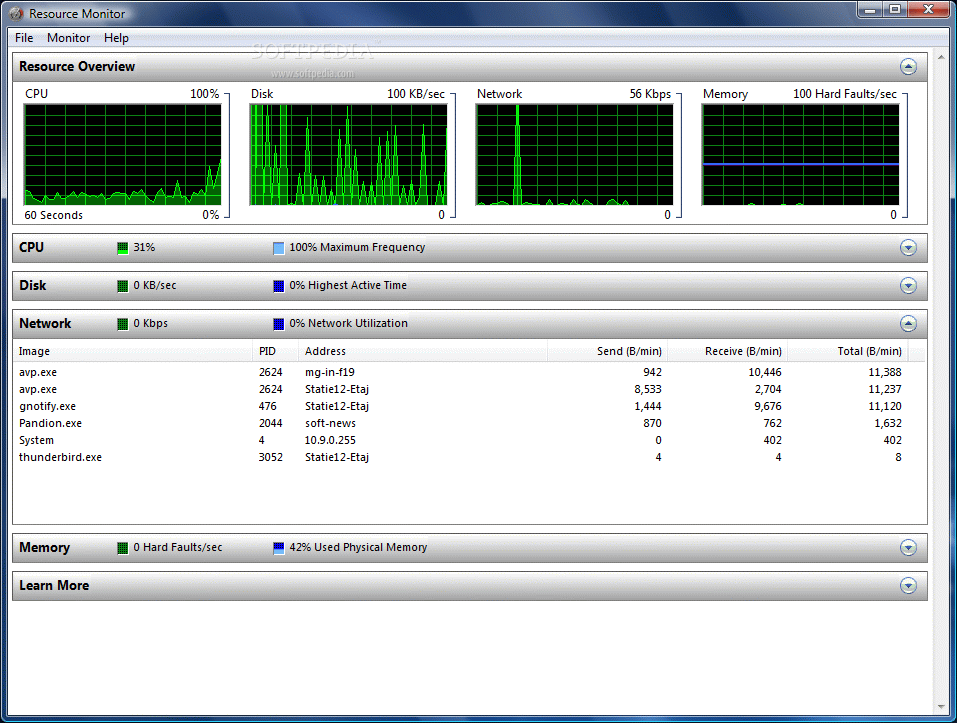
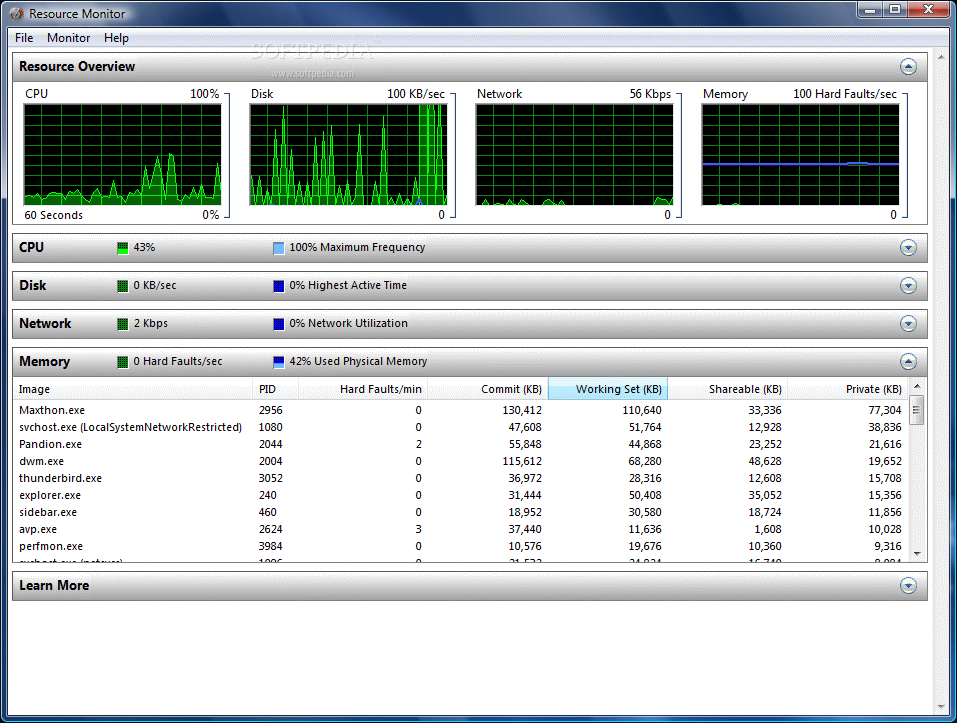
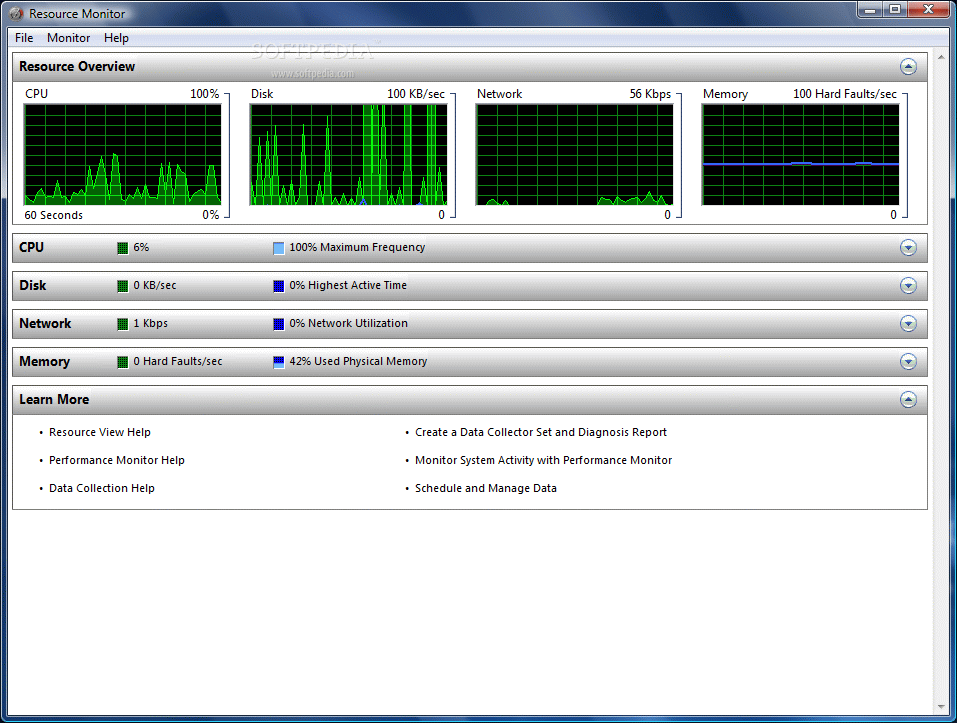
A closer look reveals a new tool for resources: Resource Monitor. It is part of Windows Reliability and Performance Monitor, a utility newly introduced in Vista. The Resource monitor's purpose, just like its name says, is to offer a more ample view on where the computer power goes. Its four views provide the necessary information on the status of your CPU (Central Processing Unit), Disk, Network and Memory on the local computer.
The real-time usage is shown in insightful graphs and lower in the screen there are the processes that use the computer resources. Clicking on one of the graphs will take you to the corresponding section and expand it to full view.
The expandable sections available are equipped with a title bar that also offers general detail on the aforementioned resources. The information in each section is process level detail and should prove quite helpful in detecting the processes that gulp too much computer assets.
CPU section gives you a good perception of the processes that are currently running and the average CPU power used. A brief description to enlighten you on the application a certain process belongs to is also available.
Disk section deals with read/write operation of the running processes. File column allows you to see the file that is being read/written by the application instance.
Network resource displays all the processes that are currently using your bandwidth. The downside is that the sent and received values are in bytes/minutes. The destination address and the total amount of bandwidth used are also available.
The last resource available in this nifty little tool is Memory. Every process displayed in Task Manager will also be present here. The information you can benefit from includes showing the amount of KB resident in memory for the application ("Working set" column), the memory an application is willing to give up in favor of other applciation ("Shareable" column) and the RAM dedicated to the process ("Private" column).
With Hard Faults/min things get a little complicated but once you have grasped its use you will find the section very handy. The hard faults occurs when the page of the address is no longer resident in physical memory (RAM) and it is available on the hard disk (backing file). The hard faults may be give the right answer when an application is moving slower then usual as if the number is high then it reads the data from the disk.
The tool does exactly what it says it does, meaning monitoring. No altering can be operated from Resource Monitor and no change to the way the processes run. For this you should refer to Task Manager or look for a different third party tool.