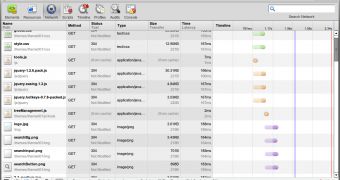
The Google Chrome Developer Tools, along with its twin Web Inspector, have gotten several updates recently, improving the debugging and developing process for Google Chrome and other WebKit-based browsers. There are changes and enhancements in several areas, network performance is one, but also with CSS editing.
Evaluating the performance of your site is a particularly important task, especially with many people enjoying broadband connections, even on mobile devices. A slow site could simply get passed by, yet the problem sometimes lies in a few likes of code or a particular script.
There is now a dedicated Network tab in Developer Tools, enabling devs to see which portions of their websites take the most to load, or why other websites load so fast.
"Network aspects of your web page are now inspected in the Network panel. This gives you access to even more information at a single glance. You can sort and clear data, preserve log information upon navigation and even export network data into HAR format," Pavel Feldman and Alexander Pavlov, Software Engineers at Google, write.
"All the timing information about your resource loads now comes from the network stack, not WebKit, so timing information now adequately represents raw network timing," they explained another change.
There are more new features in this department, for example the Developer Tools now display raw HTTP headers and status messages rather than the ones interpreted by the rendering engine.
The new Network panel can be linked back to the Speed Tracer Chrome extension.
CSS editing has been significantly improved, making Developer Tools a great way of quickly testing some variations and slight tweaks to a website's design.
"You’ll now find separate fields for property names and values instead of a single field for both. As you type, you will see suggestions of available keywords for property values," the Google developers explained.
The CSS pane now also gets its info from the browser directly, bypassing WebKit, meaning that any properties that may not be recognized by the rendering engine still show up and are editable.
You can check out other changes in an entry on the WebKit blog. You can find out more about the Developer Tools on its homepage.

 14 DAY TRIAL //