Researchers at the American space agency announce that they've found a way of using the NASA Solar Dynamics Observatory (SDO) to gain a deeper insight into the nature of solar magnetic fields. The probe may even be used to map out these magnetic fields in detail.
The SDO team wants to play a role in understanding how magnetic fields on the solar surface work and interact. Recently, they figured out that a particular type of observations the spacecraft is capable of can reveal the strength and direction of magnetic fields on the surface of the Sun.
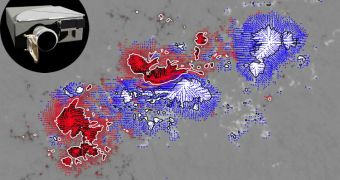
These data form so-called vector magnetograms, mini-maps of various regions of the solar surface – such as the one in the image to the left. Understanding how these datasets change through time could reveal additional insights into the very nature of the star.
Additionally, solar physicists believe that such studies could lead to a better understanding of how changing magnetic fields trigger coronal mass ejections (CME) and solar flares. These events can cause damage on Earth if their effects catch us unprepared.
The SDO can use its Helioseismic and Magnetic Imager (HMI) instrument to compile vector magnetograms, members of the science team says. The HMI was developed by experts at the Stanford University, and began active data collection in May, 2010.
In addition to measuring the strength of the solar magnetic field, the instrument is also capable of distinguishing and analyzing the sound waves propagating within the star itself. In order for this to become possible, new computer processing techniques had to be developed.
“HMI relies on interpreting the way light is affected as it travels through the fields in order to measure them from afar,” a press release from the American space agency explains.
“For example, a phenomenon known as the Zeeman effect splits light into different wavelengths based on the magnetic field strength and, in addition, light may be polarized based on the magnetic field direction,” the document adds.
This particular image reveals Active Region 11158, whose vector magnetogram was compiled from data SDO HMI collected between February 12-16, 2011.

 14 DAY TRIAL //