 14 DAY TRIAL //
 Given its functionality and power over all the apps open on the system, out of all Windows built-in tools, Task Manager is among the most employed by the users. Whenever something's slowing down the system, a peek into the Processes tab of this utility could determine the cause. And with the right click providing you the “End Process” option, you can eliminate the bugging process that heartily indulges in your system's resources.
If you are not a techie and need only the surface details, Windows' Task Manager will be great for you, but if you find yourself at the opposite end of this pole, then third-party software is the way to go. We've chosen four freebies designed to let you tinker with processes and provide you with as much information on them as possible.
Process Explorer
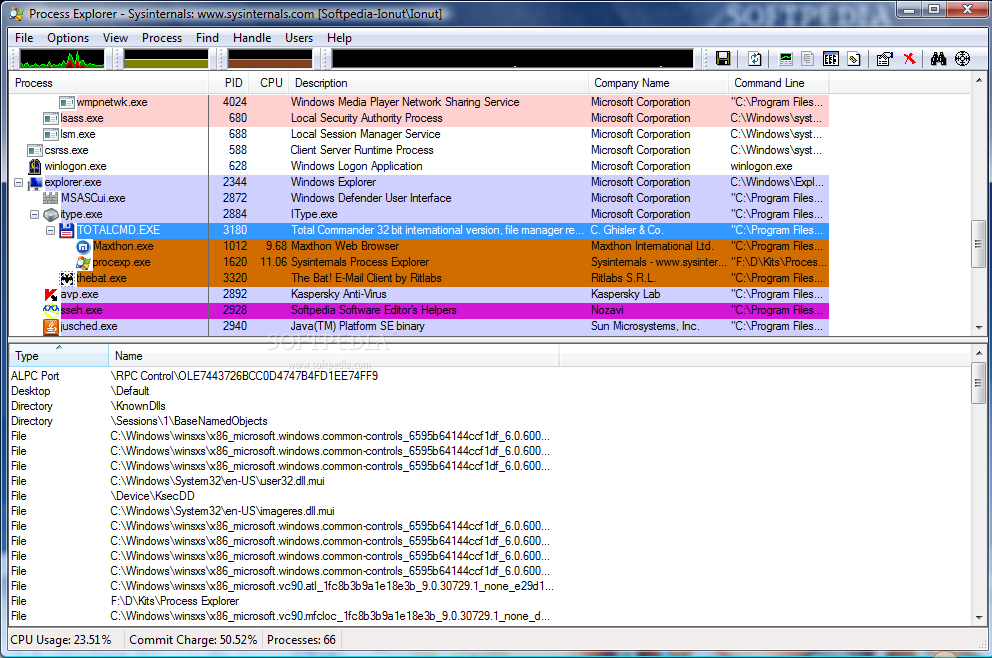
First on the list is the well-known Process Explorer from SysInternals, which is currently at version 11.33. Among the best things of the application is that it needs no installation. However, this does not mean that it is portable, as all its settings are saved in the registry.
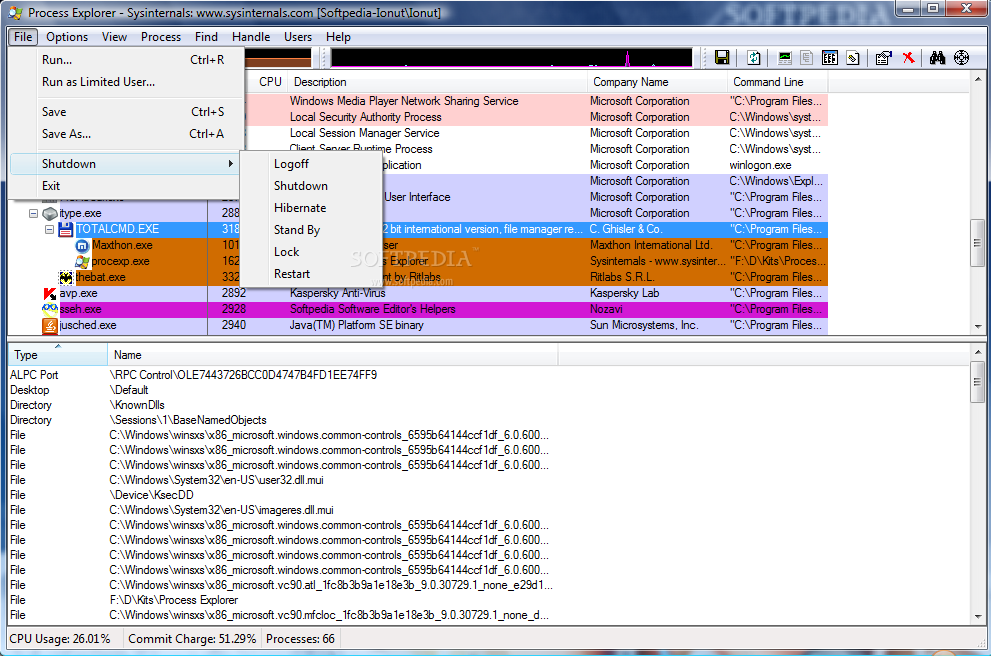
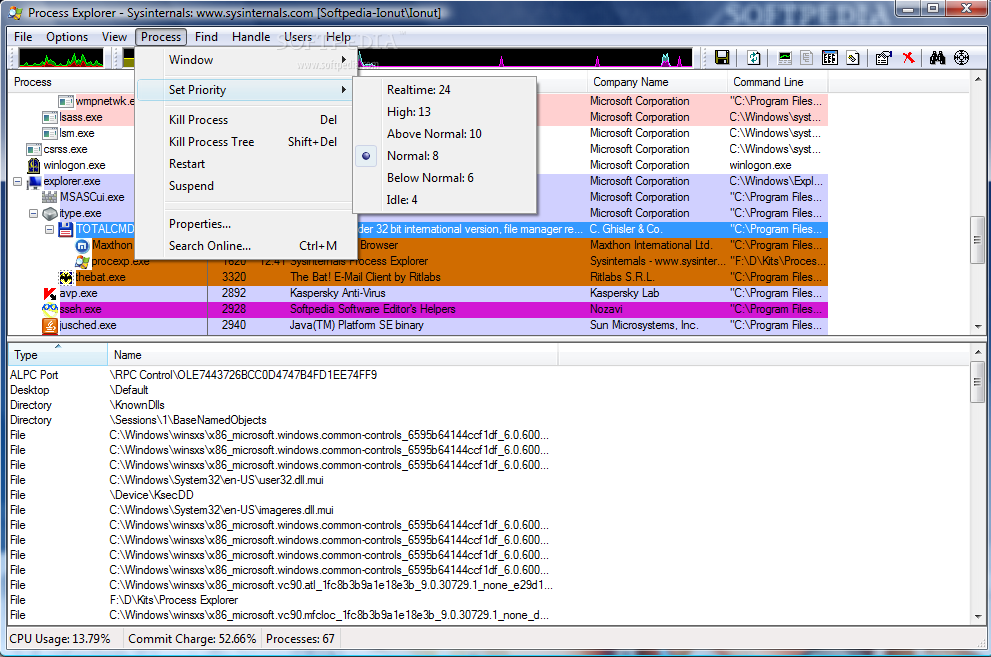
The bunch of information Process Explorer brings to the table is not restricted to showing you all running processes and allowing you to set their CPU priority or managing them as you think best. It will present additional details such as DLLs and handles of the selected process, as well as a process tree that reflects the parent-child relationship between them.
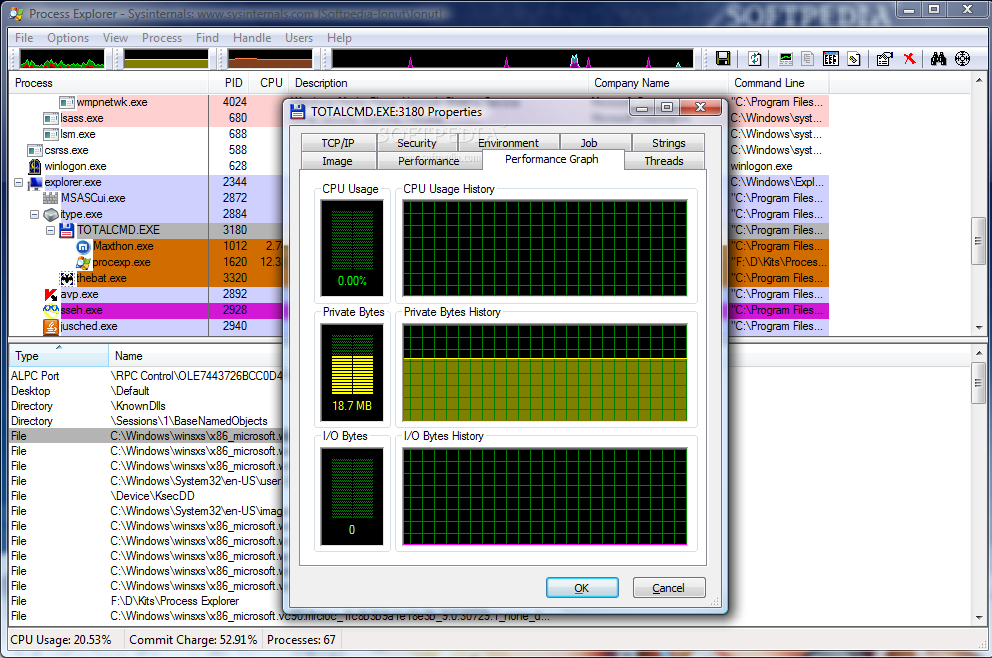
Even more, each of the listed elements benefits from its own Properties window, where you can enjoy details like the performance graph (mind that this is per process and not per system) and statistics (CPU priority, cycles, user time, I/O priority, virtual memory allocated, physical memory used, number of handles, etc.), the threads or strings.
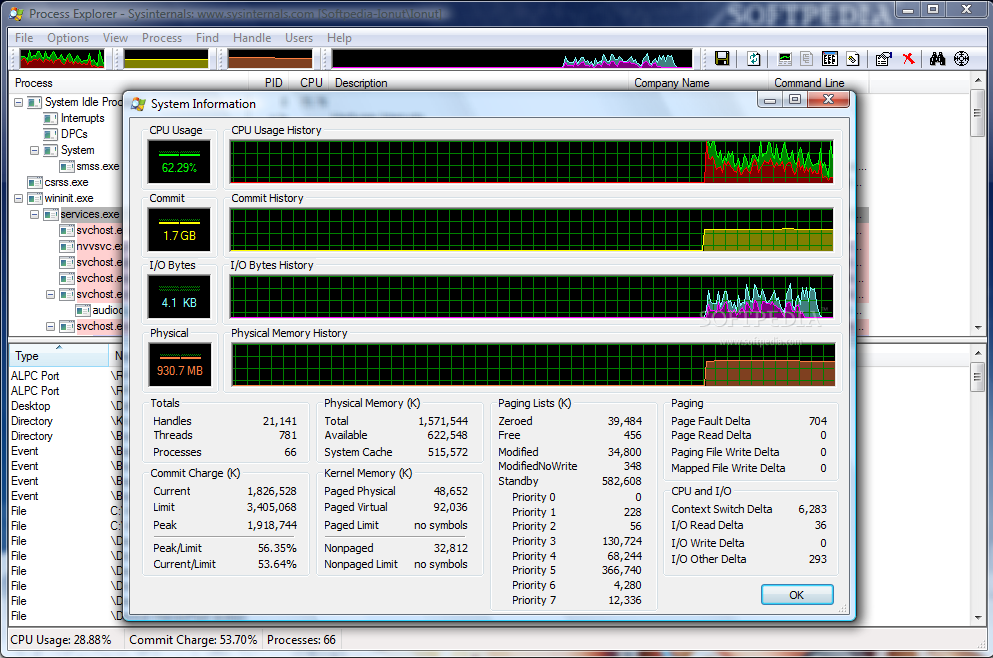
The advanced process management offered by this SysInternals tool provides the overall system information just like Task Manager, only here you benefit from more of it. Four graphs display real-time statistics on CPU usage, commit charge history, I/O bytes history and RAM usage. Details in numbers for all these can be found in the same panel and everything is automatically refreshed so as to reflect the latest state of the system.
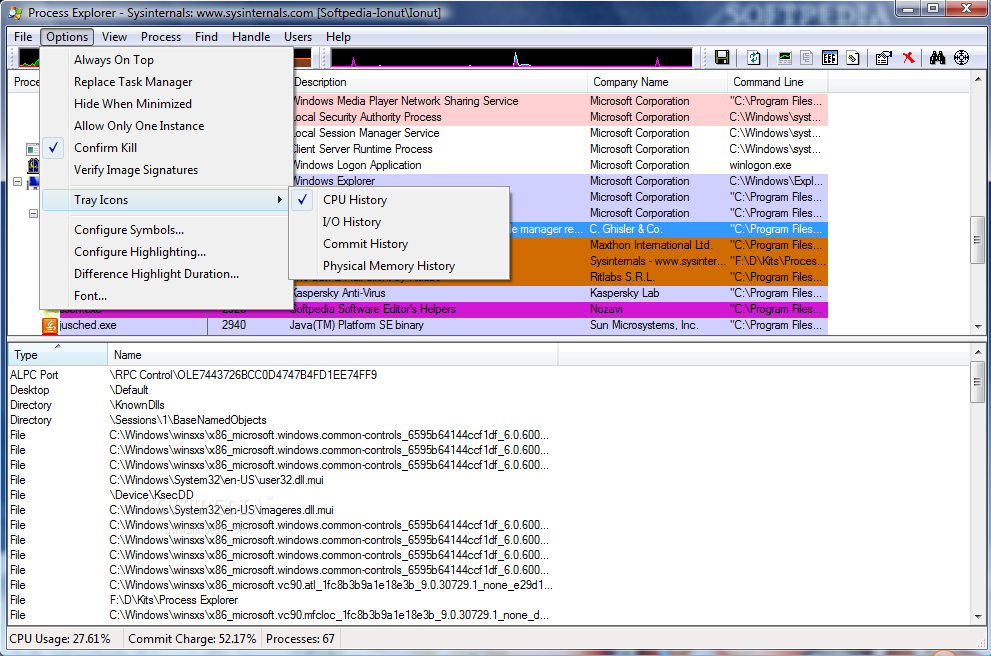
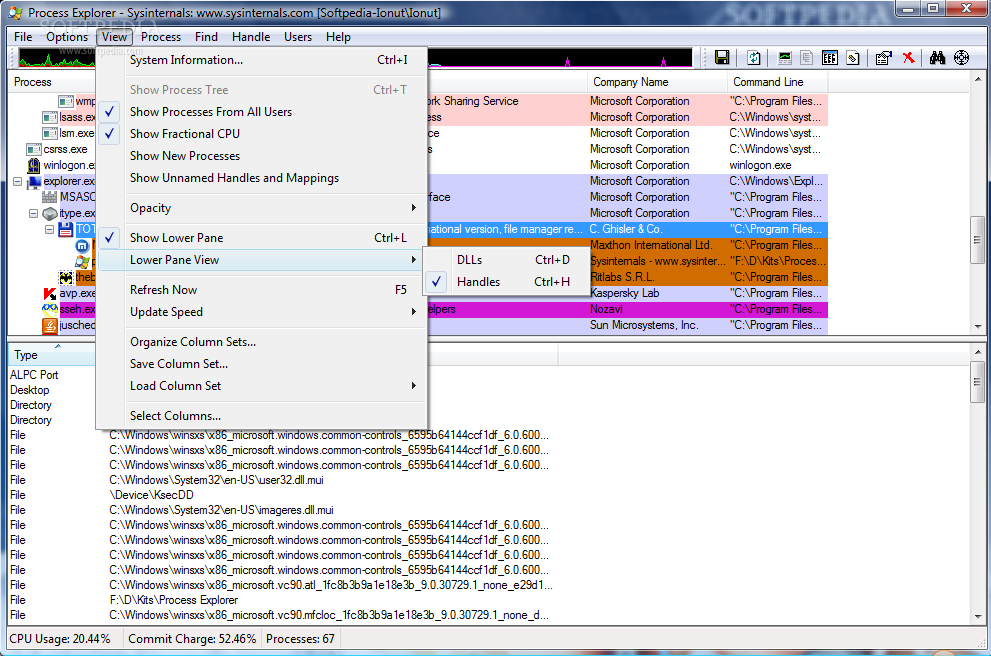
Customization settings are not at all disregarded and you can personalize the column sets to the level of details you want. The possibilities expand to saving a custom set and loading it at a later time. Also, the list of columns to be displayed is pretty impressive and covers even the needs of an uber-picky user.
Providing command line support, system information, particular process management options, a powerful search capability, a plethora of customizable details, the parent-child tree display of processes, per process info, Process Explorer turns out to be an efficient instrument to monitor your system's activity.
| Next
Process Lasso, Bill2's Process Manager, Extended Task Manager, Starter