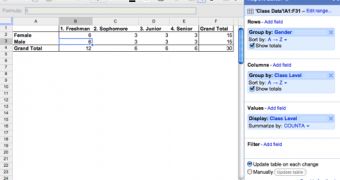
Google is introducing a powerful new feature for its Docs spreadsheet editor, pivot tables. The feature makes it easier to work with large data sets, enabling users to summarize the data or extract the details that are relevant for a certain analysis.
"Starting today, we're rolling out pivot tables in Google spreadsheets. Pivot tables make it easy to process and summarize large data sets in seconds," Matt Ziegelbaum, Software Engineer at Google, announced.
"In essence, a pivot table does just that -- it allows you to 'pivot' or rotate data, thus looking at it from different angles and seeing a variety of patterns which may not be immediately obvious," he explained.
Spreadsheet jocks should be familiar with the feature, it's been available in Excel for more than a decade now, but it's a first for the cloud office suite.
Pivot tables make it easier to extract data and view trends that would otherwise have to be determined using complex formulas. Not only are pivot tables easy to create, they're trivial to add to or alter.
"To create a pivot table, select your data and go to Data > Pivot Table Report. In the pivot table report editor, you can add fields to set your rows, columns, and values and can drag and drop the fields around within the editor," Google explained.
Google exemplifies a use for the feature with a table containing data about a group of students, their name, gender, class level and so on. Using a pivot table, you can see how the group is split by gender and class level in a few seconds.
This pivot table can then be edited, by adding a column showing the total number of students for each gender. You can further filter the table, by using some of the other columns as data points.

 14 DAY TRIAL //