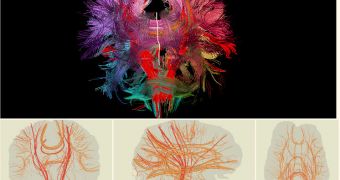
A collaboration of scientists in the United States announces the development of a new imaging technology, which enables them to create simplified, 2D images of the human brains and the neural connections it contains right on the spot.
The new software was created so that experts could get a better, simpler view of the intricate networks of connections that various neurons and brain areas create amongst themselves. The goal of the work was to create a method that provided a clearer, simplified view in this regard.
Techniques to visualize neurons in 3D exist, but the maps they provide tend to be very complex, and also to contain vast amounts of useless data, The new maps aim to reduce the load of useless information, while at the same time allowing experts access to the most relevant data.
Brown University experts say that the neural maps they created combine visual clarity with a Web-based digital map interface, which makes for ease-of-use even among laymen. Understanding myelinated axons is the end goal of this research.
The team published details of its method in the latest issue of the esteemed journal IEEE Transactions on Visualization and Computer Graphics. Its members say that these axons are known to be involved in conditions such as autism.
“In short, we have developed a new way to make 2D diagrams that illustrate 3D connectivity in human brains. You can see everything here that you can’t really see with the bigger (3D) images,” explains David Laidlaw, who is a Brown computer sciences professor.
He is also the corresponding author of the new paper detailing the findings. The expert explains that the new technique relies on using water diffusion as a measure of how axons in various regions interact.
Interestingly, the new software can be viewed in browser-based applications, such as Google Maps, explains graduate student Radu Jianu, the lead author of the new study.
“The advantage of using this mode of distribution is that users don't have to download a large dataset, put it in the right format, and then use a complicated software to try and look at it, but can simply load a webpage,” he explains.
Funding for the new investigation was secured from the US National Institutes of Health (NIH).

 14 DAY TRIAL //