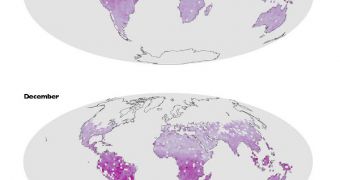
Experts at the American space agency have recently revealed an interesting, high-detail map depicting the fluorescence produced by our planet's landmass-based plants. The optical emissions come from plants, and are a byproduct of a natural phenomenon called photosynthesis.
Through it, plants convert carbon dioxide from the Earth's atmosphere and sunlight into oxygen and energy for their everyday functioning. When viewed from space, plants who function properly appear brighter than those that are affected by other factors.
These may include, but are by no means limited to, droughts, floods, wildfires and other natural or man-made phenomena. Orbital spacecraft can easily detect these changes, and determine which areas of vegetation are healthy, and which are not.
According to NASA, this is the first map of its type focused entirely on global land vegetation. Others touched on the topic only partially, in the sense that they also covered oceans, and did not have the same level of precision and insight the current map has.
Using chlorophyll fluorescence, satellites can now detect the changes plants go through in real-time, without having to wait for weeks before data become available (as customary with regular fluorescence).
“With chlorophyll fluorescence, we should be able to tell immediately if plants are under environmental stress – before outward signs of browning or yellowing of leaves become visible,” explains researcher Elizabeth Middleton.
The expert is a member of the team that created the new maps. She holds an appointment as a biologist at the NASA Goddard Space Flight Center (GSFC), in Greenbelt, Maryland. The expert says that the Japanese Greenhouse Gases Observing Satellite (GOSAT) collected the data used in the maps in 2009.
“Chloroplasts re-emit about two percent of incoming light at longer, redder wavelengths. This re-emitted light – fluorescent light – is what the Goddard scientists measured to create their map,” NASA explains in a press release.
“Fluorescence is different than bioluminescence, the chemically-driven mechanism lightning bugs and many marine species use to glow without exposure to light,” the statement concludes.

 14 DAY TRIAL //