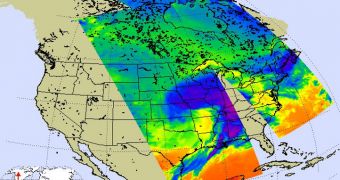
The continental United States are currently half-covered by a massive atmospheric front, that brings with it massive amounts of precipitations in the form of snow storms and heavy winds.
All of the East Coast and parts of the South and the Midwest are affected by the atmospheric event, which is considerably more “brutal” in areas surrounding the Great Lakes, such as Chicago.
In past studies, experts discovered that proximity to the Lakes was a clear indicator of how strong an area will be battered by snowstorms, but the exact reason why that happened was never clearly established.
Now, climate scientists funded by the US National Science Foundation (NSF) are using heavy-duty trucks outfitted with Doppler radars to keep track of the entire region. They hope that the correlation will not escape their sensitive instruments.
But scientists' joy is regular people's misery, so to speak. Entire cities are paralyzed by the snow storms, which deposited inches upon inches of snow on homes, driveways, cars and roads.
The extent of the snow storm is currently being surveyed by the American space agency, which is using its Aqua satellite to image the clouds from orbit. The Atmospheric Infrared Sounder (AIRS) instrument aboard the spacecraft is especially suited for such investigations.
In the image attached to this article, we can clearly see that large portions of Canada and the US being covered in blankets of cold air, shown in hues of blue, purple and green. This composite view was taken on February 1.
Data collected by the AIRS are generally used by climate expert to construct accurate 3D maps and models of atmospheric temperature, water vapor and cloud levels at the time of the observations.
This aids the experts in forecasting weather patterns more accurately, say investigators at the NASA Jet Propulsion Laboratory (JPL), in Pasadena, California. The team here designed and constructed the satellite instrument, and process the telemetry data it sends back to Earth.
“The image shows the temperature of the storm's cloud tops or the surface of Earth in cloud-free regions. The coldest cloud-top temperatures appear in purple, indicating towering cold clouds and heavy precipitation,” a JPL press release explains.
“The infrared signal of AIRS does not penetrate through clouds. Where there are no clouds, AIRS reads the infrared signal from the surface of the ocean waters, revealing warmer temperatures in orange and red,” the statement adds.

 14 DAY TRIAL //