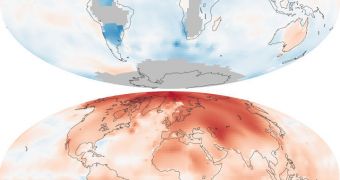
The NASA Earth Observatory published today, December 10, a series of graphs showing how global temperatures have risen since 1880, when reliable weather records began being kept.
Regardless of the cause, the fact of the matter is that the Earth is getting warmer, as evidenced by the 13 images showing the evolution of temperatures during every single decade since 1880.
Global warming and climate change is mainly caused by human activity, with a small part of it accounted for by natural variability.
The beginning of the Industrial Revolution coincides with the start of the upward temperature trend, experts at the American space agency reveal.
At this point, thermometer readings around the world are showing values that are out of tune with normal level for every single period of the year. Some nations are for example experiencing floods in the winter, which is fairly uncommon for countries at mid-latitudes.
The new investigation was conducted by scientists at the NASA Goddard Institute for Space Studies (GISS), who looked at temperature records spanning back 130 years.
They were able to determine that the average global temperature on our planet has increased by about 0.8°Celsius (1.4°Fahrenheit) since 1880, with more than 66 percent of this rise being recorded in the past 35 years.
This discovery lends additional credence to the idea that the effects of global warming are accelerating as the time passes, and that we may soon reach a tipping point beyond which all of our efforts to mitigate climate change would be in vein.
“The global temperature record represents an average over the entire surface of the planet,” say experts with the NASA Earth Observatory.
“The temperatures we experience locally and in short periods can fluctuate significantly due to predictable cyclical events (night and day, summer and winter) and hard-to-predict wind and precipitation patterns,” they add.
“But the global temperature mainly depends on how much energy the planet receives from the Sun and how much it radiates back into space – quantities that change very little,” the experts say,
“The amount of energy radiated by the Earth depends significantly on the chemical composition of the atmosphere, particularly the amount of heat-trapping greenhouse gases,” they add.
What global warming critics fail (or pretend not) to understand is that it takes a significant amount of warming to heat up all of the world's oceans and landmasses by a single degree.
For reference, consider that each time in our planet's history that global temperatures dropped by as little as 2 degrees, Little Ice Ages started. Now take a look at the maps and decide for yourself.

 14 DAY TRIAL //