14 DAY TRIAL //
 As we have seen, Linux systems contain a great variety of tools: tools to help manipulate files, transfer data, compile code and so on, but they also contain tools that let you track and analyze the performance of your PC, by evaluating the way your PC uses hardware and system services, including RAM, CPU and hard drivers. With the information provided by these tools, you can uncover potential problems, locate and fix performance bottlenecks and make sure your computer is running in tip-top shape.
Besides the tools that are included in most Linux distributions, you'll also find additional ones available on various websites and in your distribution's repository. Basically, they're divided into three categories:
* Tools that run in a graphical interface (X11) * Tools that run in a console (terminal) * Tools that run on a web server (Apache)
X11 BASED TOOLS
GKrellM
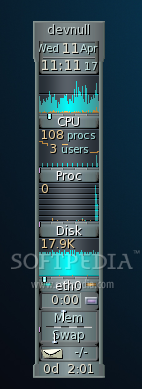
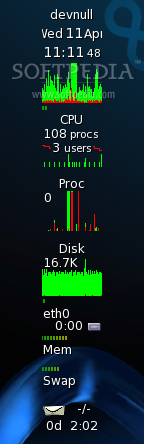
GKrellM is basically a stack of system monitors that has been quite popular among 'th3 l33t', or advanced (wannabe) Linux users. It came to life sometime in '99 and it gained enthusiastic users, plug-ins and themes for a long time since then. However, over the years, other similar projects have come to life and attracted new users, as well as existing users. Nowadays, GKrellM is still a good monitoring tool for the modern desktop, with lots and lots of plug-ins and themes to choose from. However, it's a bit too flashy and eye-candy for my taste but that's my opinion and it could very well differ from other opinions.
Several packages are available in most repositories, and you can search for them by opening your package manager (Synaptic, Yumex, Yast) and searching for gkrellm. I recommend you to install gkrellm and gkrellm-themes; you won't need anything else.
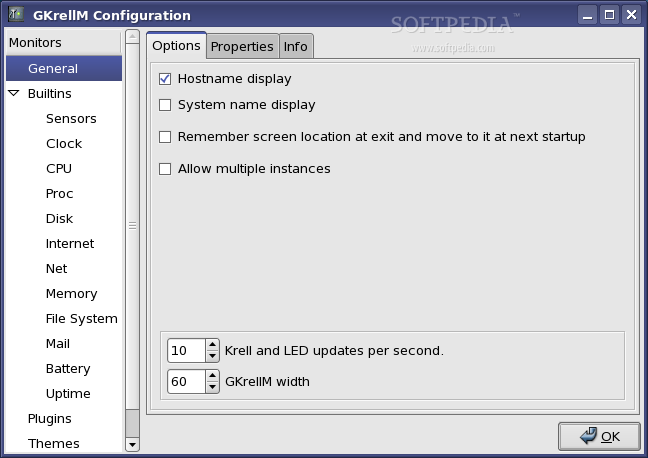
Once installed, left clicking on charts will toggle a display of some extra info, right clicking on charts will open chart configuration dialog and F1 will open the general configuration dialog.
Desktop Included Tools
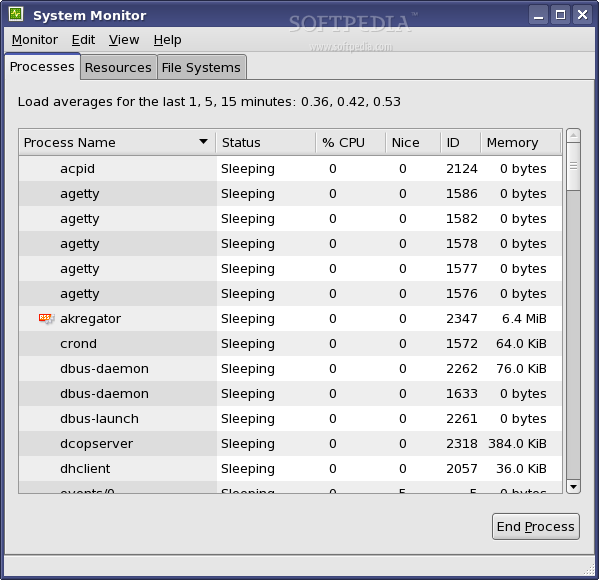
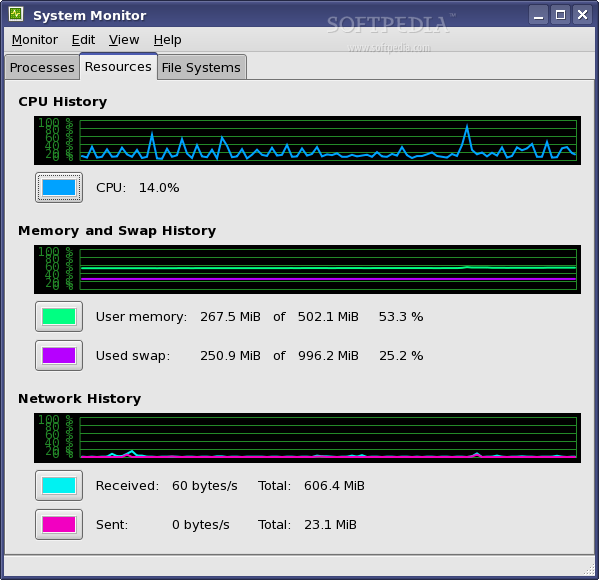
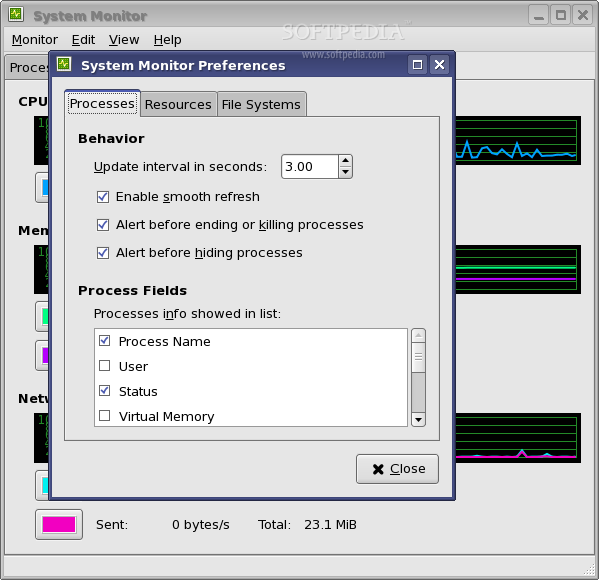
gnome-system-monitor is a graphical tool installed as part of the Gnome desktop system. It's somewhat similar to MS Windows' Task Manager as it displays the running processes and CPU/Mem/Network load. The processes tab is the only one that lets you do anything so you won't be able to change what it monitors and it requires Gnome to be installed.
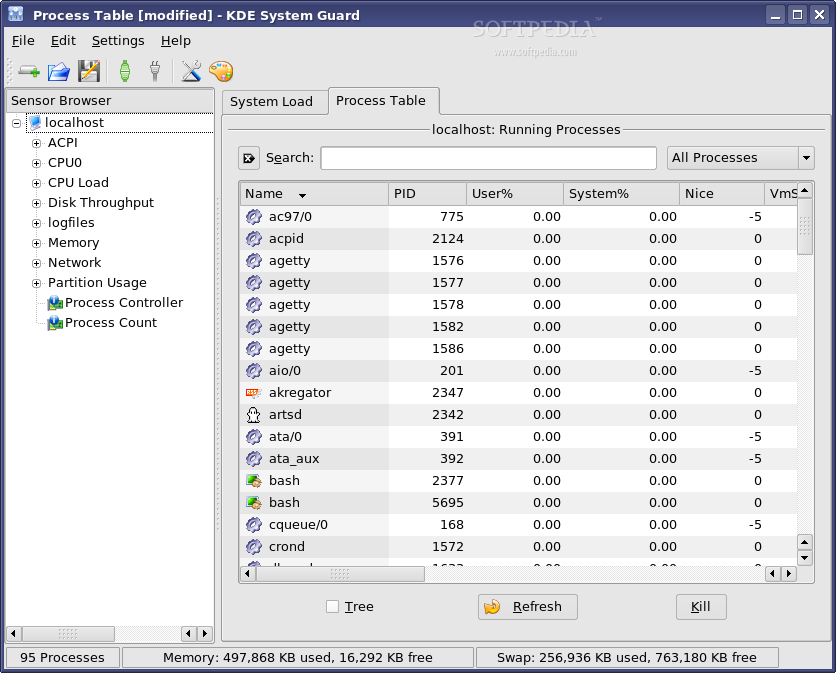
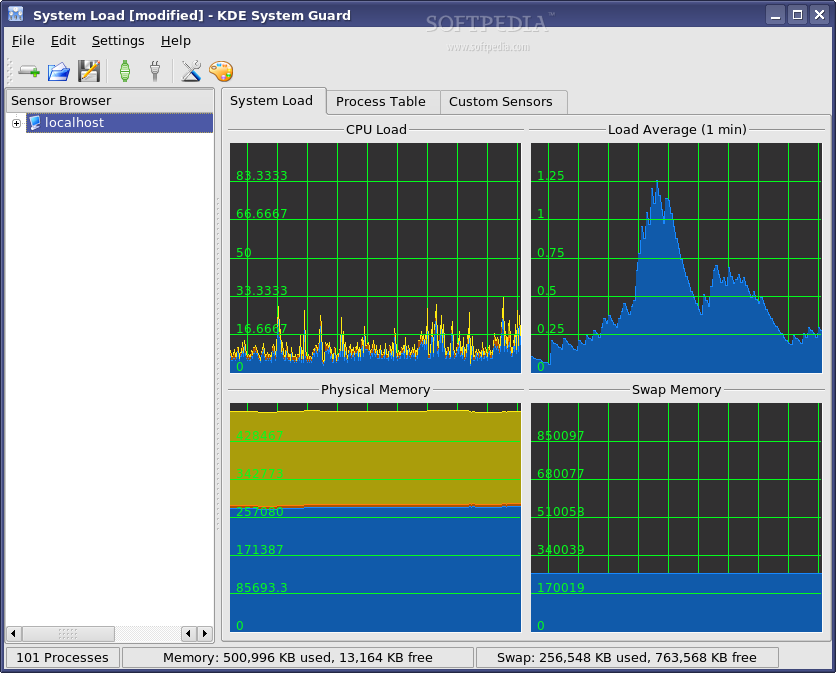
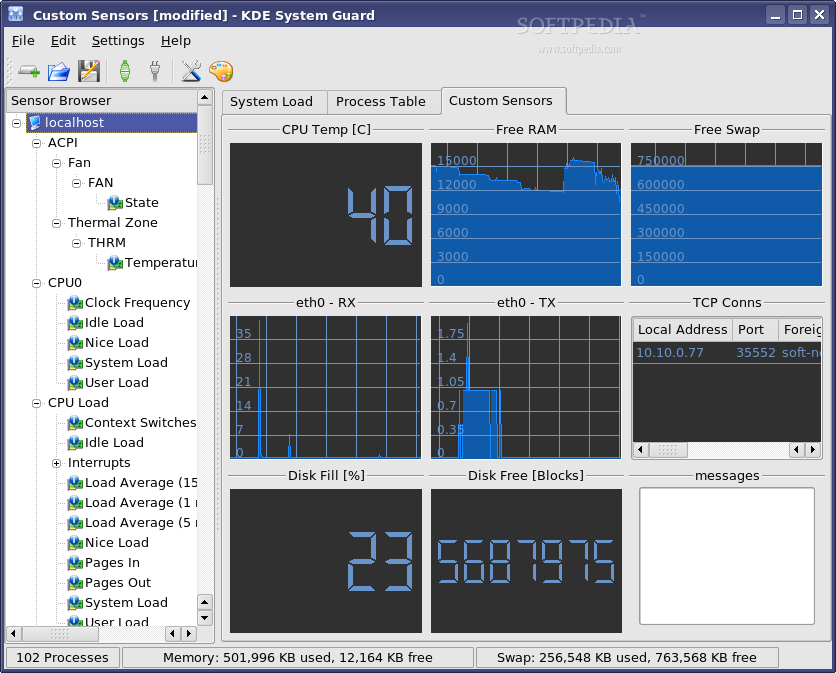
KSysGuard is the KDE version of Gnome-sys-monitor. By default, it also lists the running processes and displays graphs for CPU/Mem/Total load. However, unlike the Gnome tool, KDE System Guard allows you to select additional sensors for monitoring and change the way the data is displayed. It offers more control and it looks nicer (just like KDE is over Gnome).
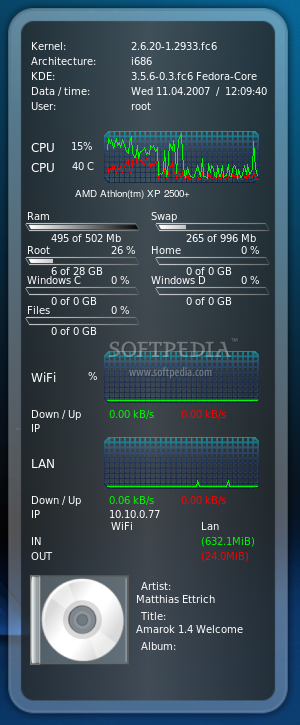
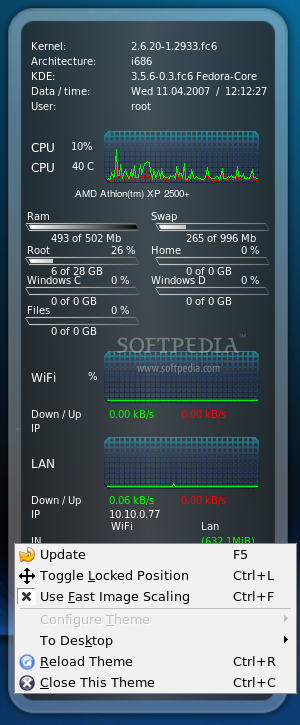
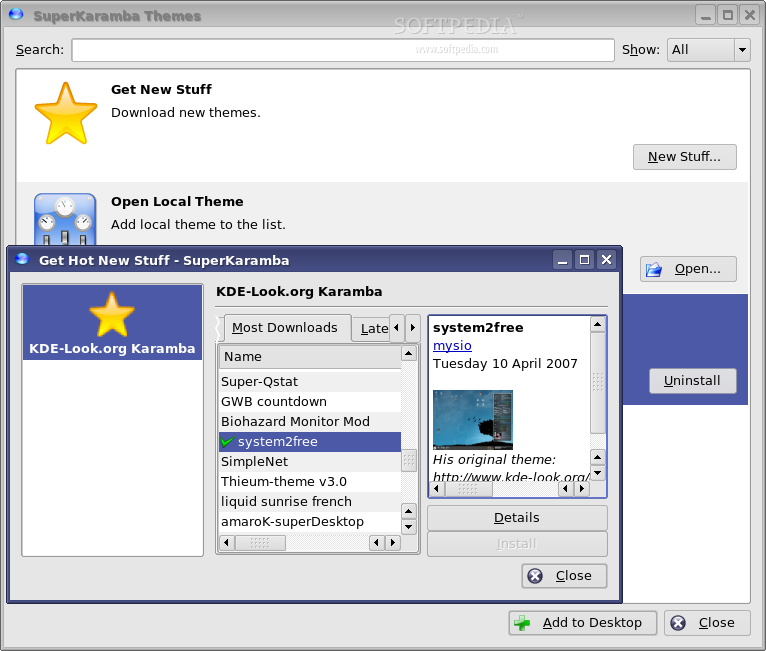
SuperKaramba
SuperKaramba is a tool that allows interactive programs (widgets) to be embedded into the desktop background without disturbing the running programs or desktop view. Authors create themes that define their widget using plain text or Python scripts. The resulted widgets have endless possible uses, not just system monitoring.
SuperKaramba is currently included in KDE 3.5 but not limited to it. It can run on other desktop environments as long as certain KDE libraries are installed. There is however a similar program for a Gnome user that prefers not to install the additional KDE libraries - gDesklets.
CONSOLE BASED TOOLS
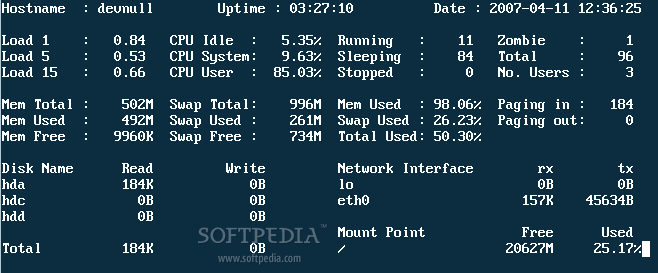
saidar
saidar is a curses-based tool which displays system statistics such as number of processes, CPU and memory load, swap, network and disks usage. It's useful for monitoring servers through an SSH connection so it doesn't require a running desktop environment. Unfortunately, it's not included in most distributions but you can find it in their repositories. For Fedora, I've noticed that saidar is part of statgrab-tools package, while for Ubuntu I think is distributed as a stand-alone package so try searching for its name.
Once installed, type saidar in a terminal to start it.
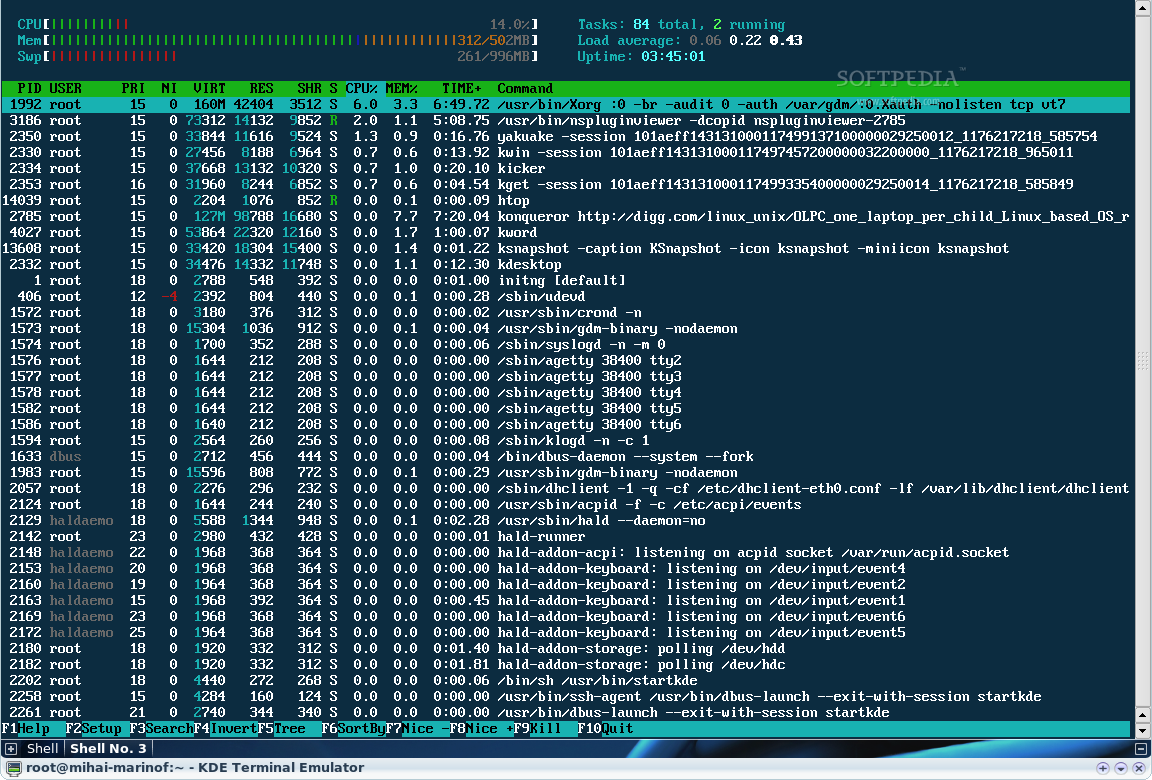
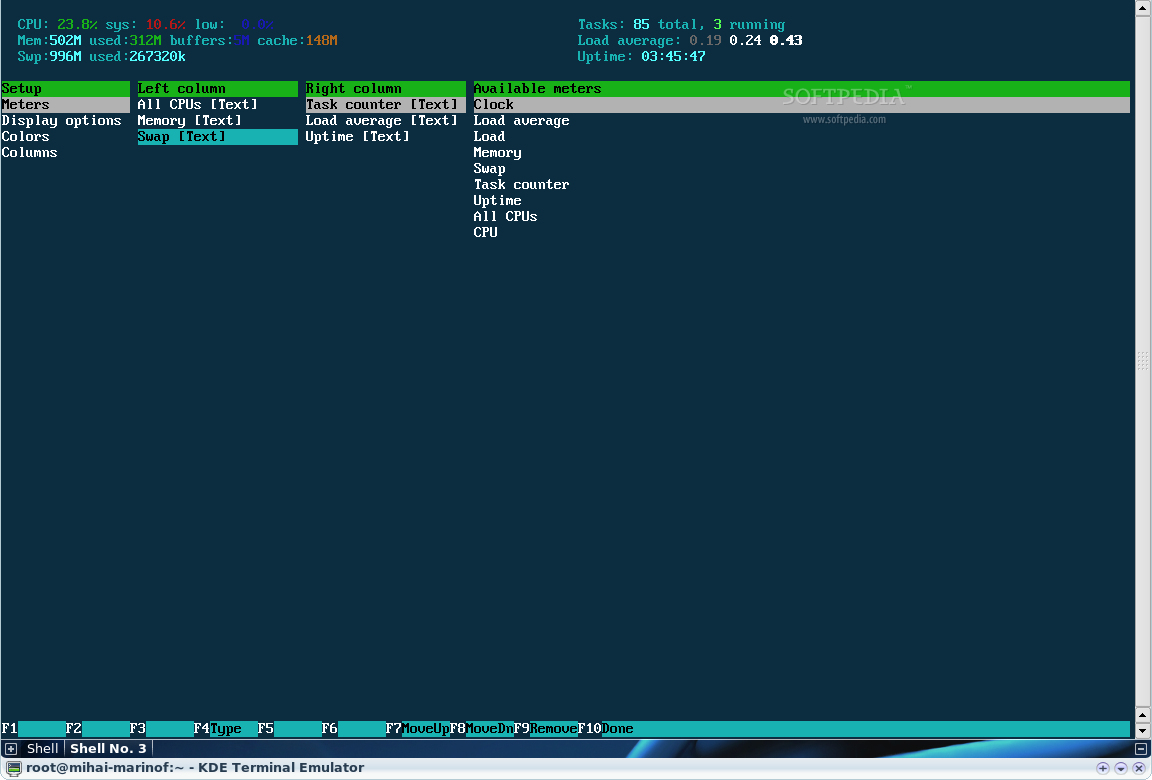
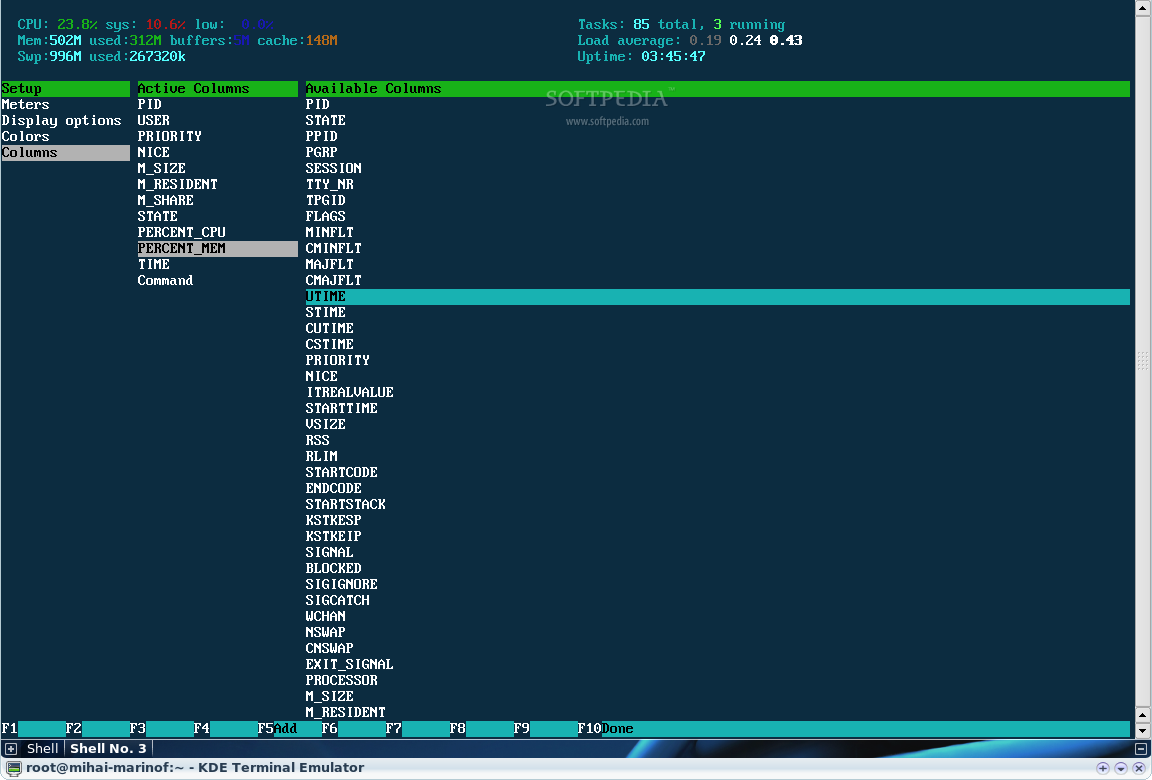
htop is an enhanced version of top, the traditional tool for displaying running processes, CPU, Mem and Swap load. Unlike top, htop allows you to scroll vertically and horizontally to see all the processes and complete command lines, it supports mouse operation, it has color and is highly configurable. Very good tool for monitoring a computer remotely, through ssh.
Unlike top (which is part of procps package and included in every Linux distribution), htop needs to be installed first. Fortunately, it's available in most repositories so you'll have to search and install the 'htop' package using your package manager.
Network Related Tools
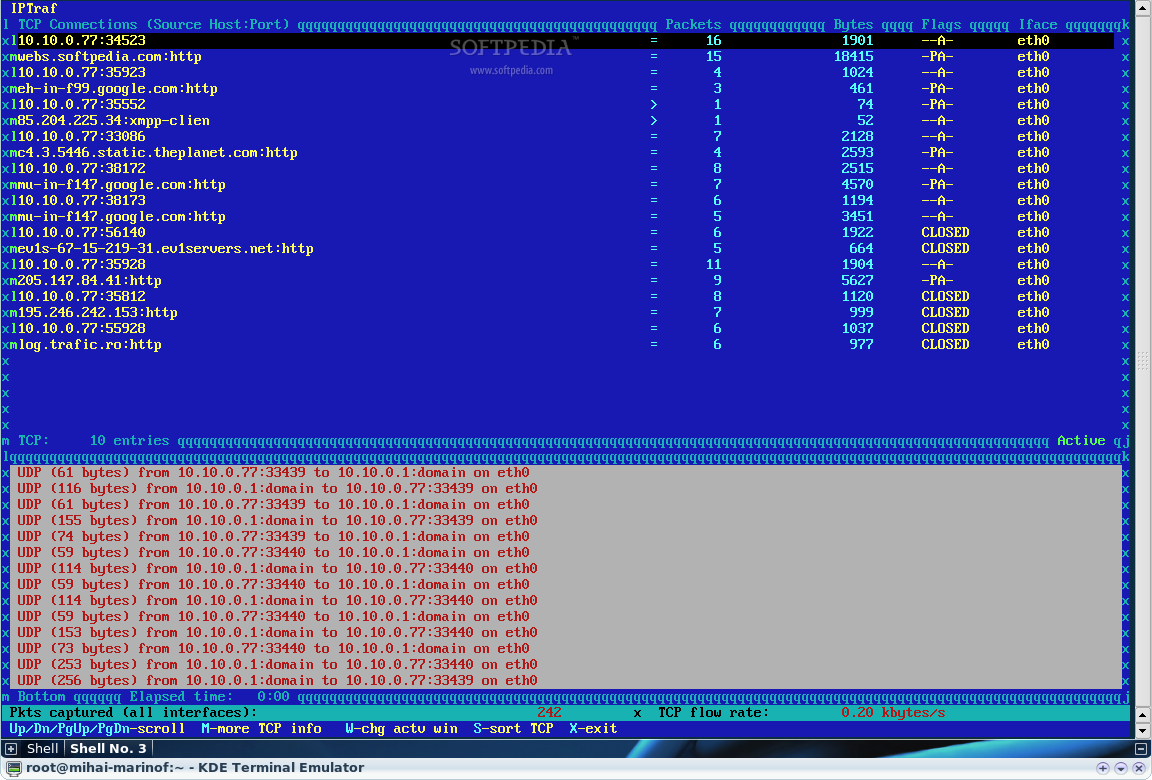
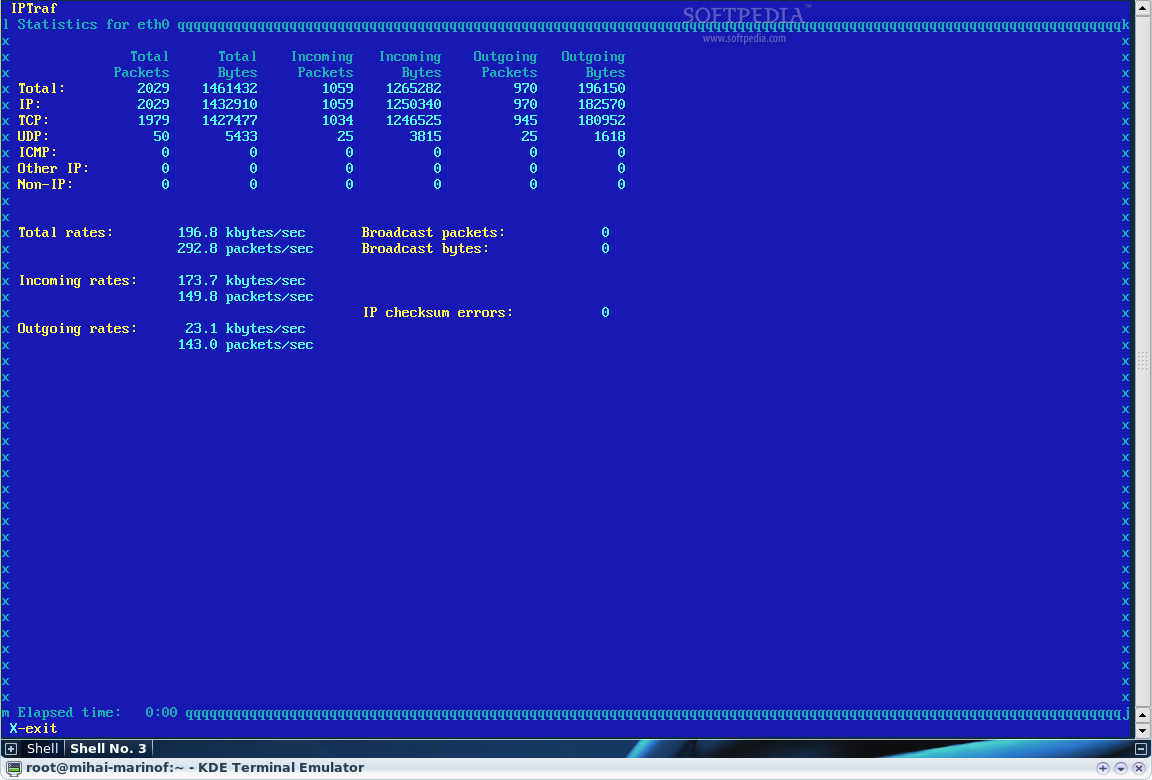
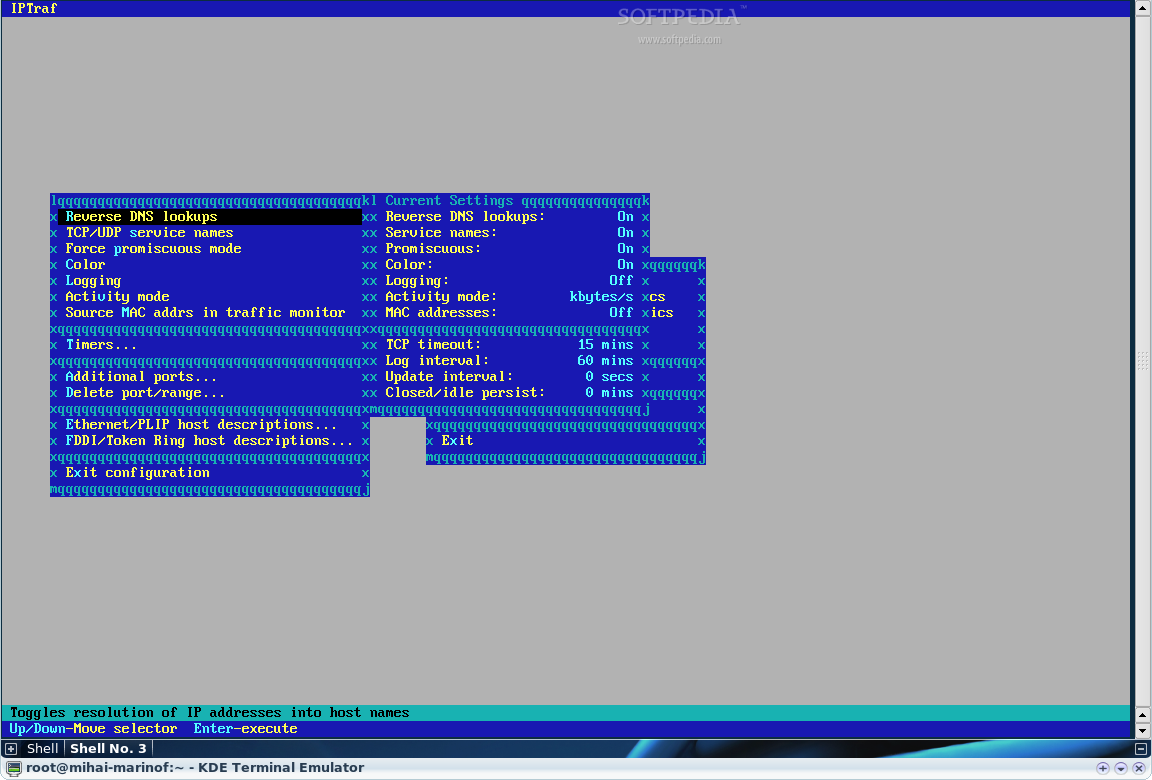
iptraf is a ncurses-based network monitor that displays various connection statistics including TCP info, UDP counts, ICMP and OSPF information, Ethernet load info, note stats, IP checksum errors, incoming/outgoing/total rates and more. It's one of the most popular network tools for Linux and it's included in most distributions.
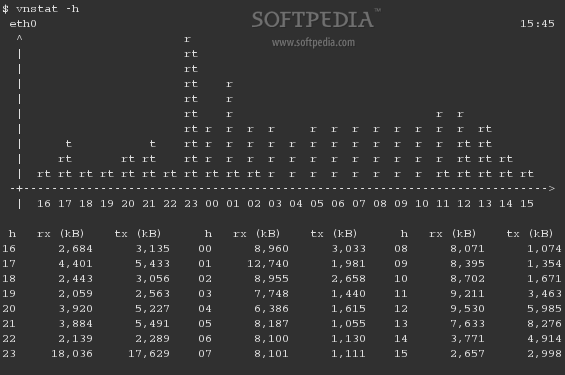
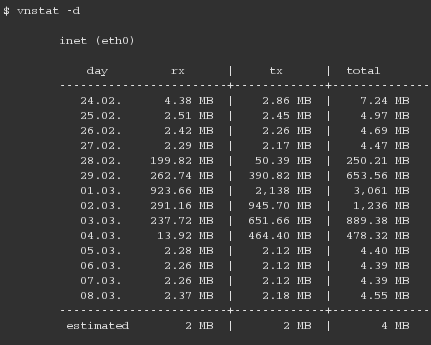
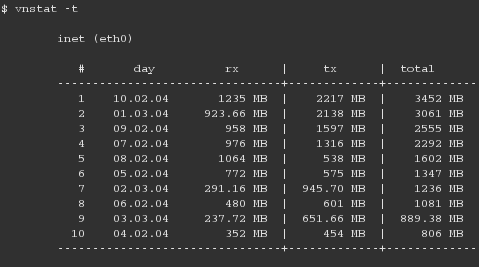
vnstat is a bandwidth monitor for the Linux console. It can display the data in hourly, daily or monthly increments using command line options. For instance, to view daily bandwidth usage, type vnstat -d. You should also add the -i eth0 option if you have more than one interface (and of course, choose the one connected to the Internet).
vnstat can be installed using your package manager. Just look for and install the 'vnstat' package.
WEBSERVER BASED TOOLS
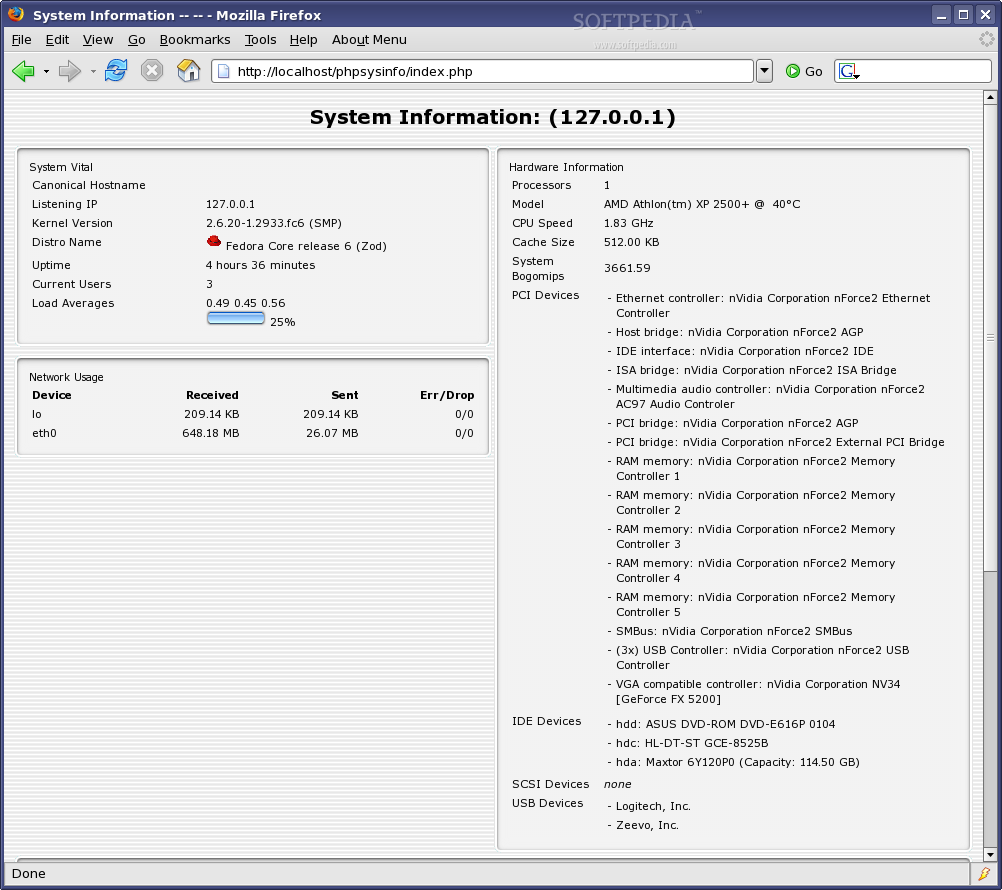
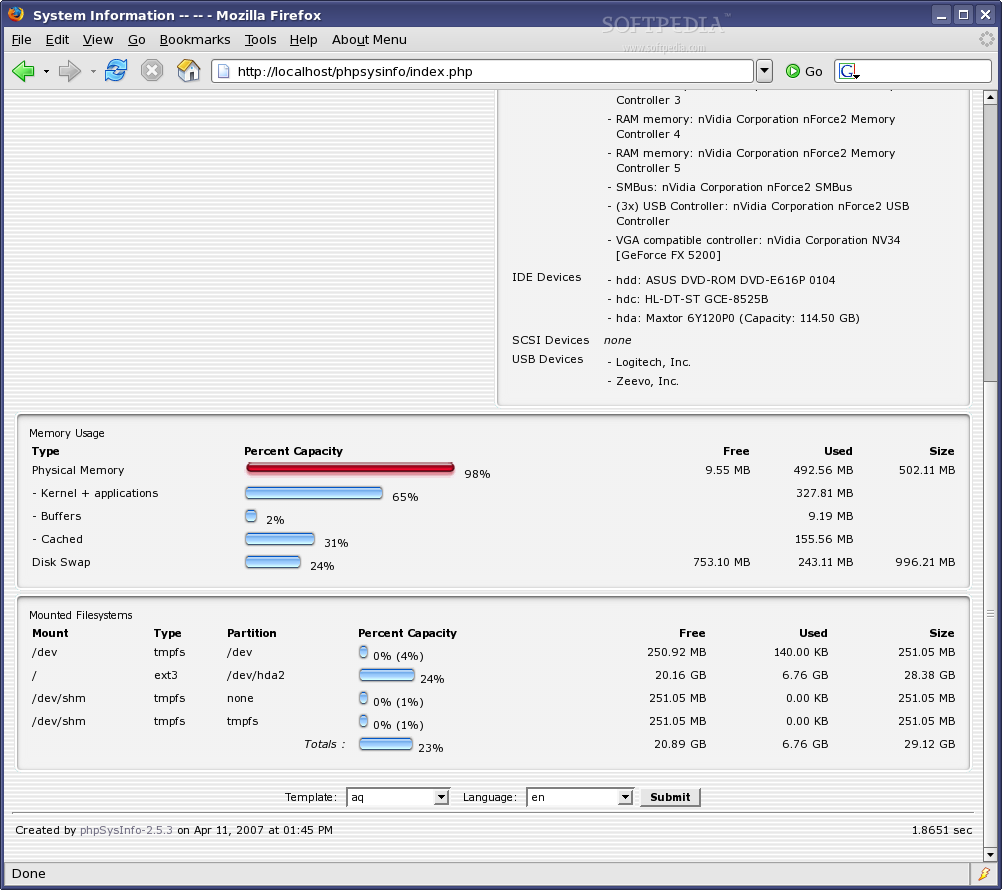
phpSysInfo
.. is a very well designed PHP script used to display information about the host it's installed on. It displays info like uptime, CPU, Mem, SCSI, IDE, PCI, Ethernet and Video. It doesn't require any additional webserver configuration, just extract it in a webroot subdirectory and point your browser to it.
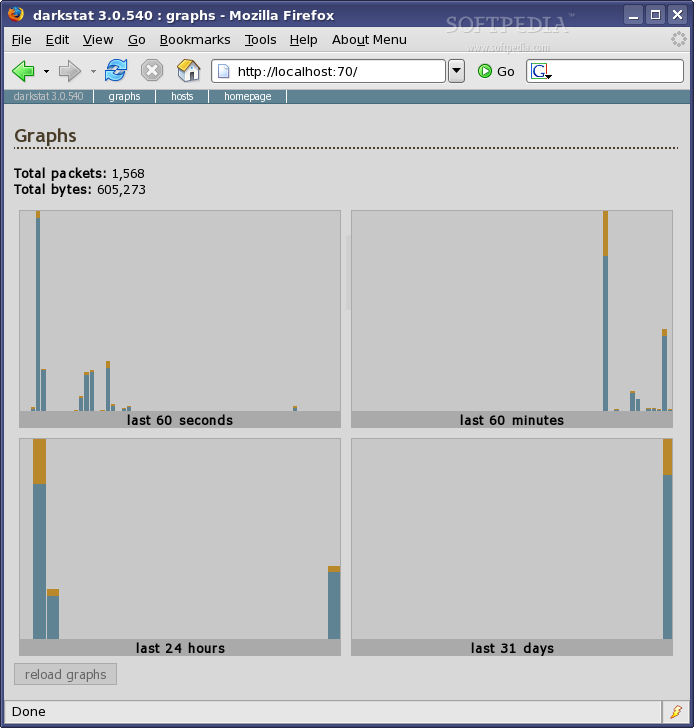
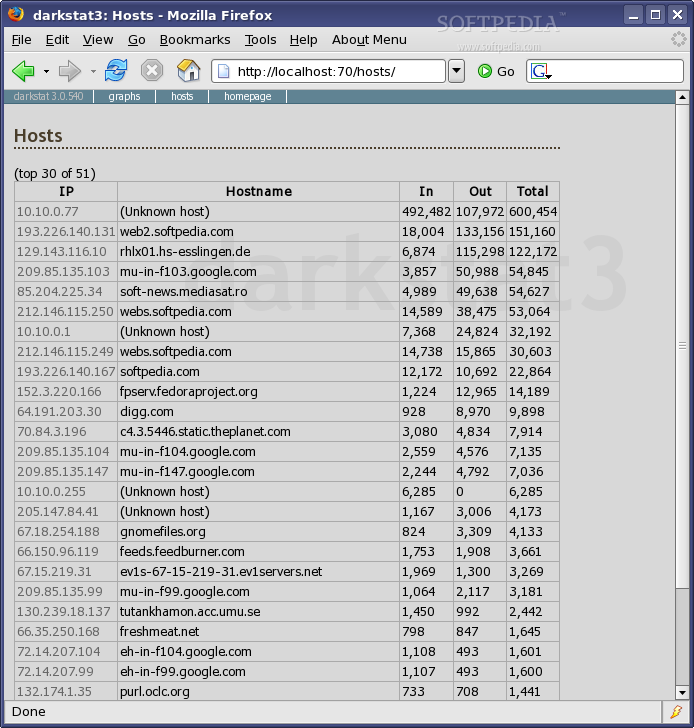
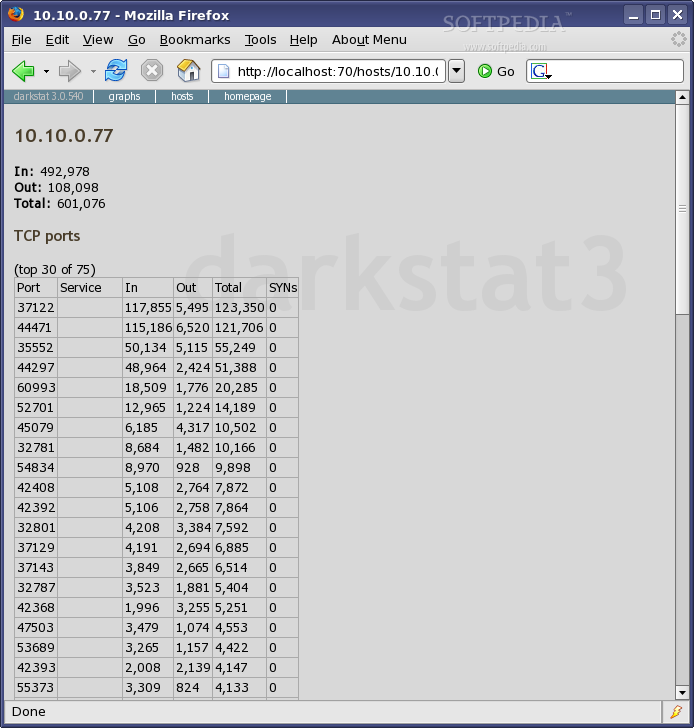
DarkStat
darkstat is a network statistics gatherer. Effectively, it's a packet sniffer, which runs as a background process on a server or cable/DSL router, gathers statistics and serves them over HTTP. All settings are passed on the command line.
It doesn't require a web server, just the libpcap library. You can install it on Ubuntu using apt-get install darkstat. Once installed, edit /etc/darkstat/init.cfg and set START_DARKSTAT=yes. You can choose which interface to listen on and which port, as well as which address to bind to. You can also set a filter, for instance, if you're only interested in traffic on a specific port.
On Fedora, you'll need to install the libpcap-devel as well and download the source package, compile and install it.
After installation, open a browser and point it to the configured address and port.