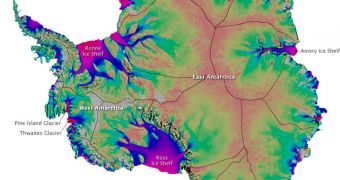
A collaboration of space agencies around the world announces the creation of the world's most comprehensive map of ice flows in Antarctica. The work will help climate researchers and planetary scientists understand how sea levels will rise over the next decades.
The investigation was part of an ambitious science program called the International Polar Year (IPY), which took place in 2007 and 2008. A large number of space agencies and research organizations participated in studies related to the current situation at both poles.
During the IPY, satellites belonging to many countries were trained on the Arctic and Antarctica. They studied how ice flows, how it breaks off from shelves, and how it melts in the surrounding oceans.
At the same time, the spacecraft's instruments managed to identify entire networks of glaciers that channel ice to certain key areas on the Southern Continent. Collecting these data was only made possible by the fact that space agencies optimized their collaboration to a great extent.
The European Space Agency's (ESA) Envisat, the Canadian Space Agency's (CSA) Radarsat and the Japan Aerospace Exploration Agency’s (JAXA) ALOS spacecraft played an instrumental role in the development of the new map, especially for Antarctica.
Billions of radar data points had to be connected in order for the first radio map of ice motion in the Antarctic to be created. At this point, the final product is indicative of the massive wealth of information scientists collected during IPY.
The map itself was put together by experts at the NASA Jet Propulsion Laboratory (JPL), in Pasadena, and the University of California in Irvine (UCI). The American space agency also provided part of the funds needed to carry out the research.
In the end, the combination of scientific instruments the international collaboration had at its disposal managed to identify the largest glaciers on the continent. Furthermore, the team also found most of their tributaries, smaller rivers of ice that can stretch for thousands of miles.
“This is like seeing a map of all the oceans' currents for the first time. It's a game changer for glaciology. We're seeing amazing flows from the heart of the continent that have never been described before,” says JPL expert Eric Rignot, the lead author of the study presenting the map.
“The challenge to understand and quantify the impact of ice sheet mass loss on sea level is a global scientific endeavor spanning the capabilities of more than one single country or space agency,” says ESA scientist Mark Drinkwater.
“This result is one of the scientific highlights stemming from the intense international coordination amongst the spacefaring nations during IPY. Armed with this information, scientists are now able to improve models of ice sheet flow, and to reduce uncertainty in predictions of the impact of climate warming on global sea level,” he concludes.

 14 DAY TRIAL //