The extent of ice sheets covering the Arctic was the second-lowest in recorded history, since satellite observations of the region began back in 1979. What this means is that the trend of declining summer ice cover is continuing unabated.
In all fairness, authorities failed to take any type of measures to prevent the effects of global warming on Arctic or Antarctic regions, or in Greenland. As such, measurements conducted on a monthly and yearly basis are showing a constant tendency of ice loss in all these three areas.
Among themselves, the regions contain most of the world's ices, and they are all warming up rapidly. This helps explain why, in recent years, ice extents have continuously declined around the world.
Though Arctic ice extent this year was greater than in June 2010, the value is well beyond average levels. At this time, “sea ice has entered a critical period of the melt season,” a press release from the US National Snow and Ice Data Center (NSIDC).
“Weather over the next few weeks will determine whether the Arctic sea ice cover will again approach record lows,” experts write in the new document, which covers the evolution of Arctic ices for the month of June.
The NSIDC usually releases its report during the first week after a month is over. Scientists here need the time in order to centralize readings and datasets collected from multiple locations into a comprehensive view of what's going on in the field.
“Average ice extent for June 2011 was 11.01 million square kilometers (4.25 million square miles). This is 140,000 square kilometers (54,000 square miles) above the previous record low for the month, set in June 2010,” the analysis indicates.
This value is also 2.15 million square kilometers (830,000 square miles) below the average for 1979 to 2000, which is used as a baseline measurement for assessing the evolution of ice extents.
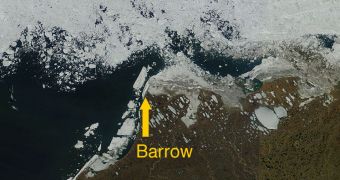
“June ice extent was lower than normal in much of the Arctic, but the Kara Sea region had particularly low ice extent. Ice has also started to break up off the coast of Alaska in the Beaufort Sea,” the report indicates.
A possible explanation for this could be that previous ice melts have caused the waters in these areas to darken. In turn, this attracts more sunlight, and makes the seas absorb even more heat than usual. In the end, this chain of events leads to warmer waters surrounding the ices.
“Ice extent during June 2011 declined at an average rate of 80,800 square kilometers (31,200 square miles) per day, about 50% faster than the average decline rate for June 1979 to 2000,” the NSIDC report concludes.

 14 DAY TRIAL //