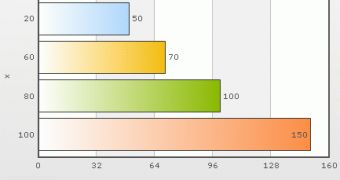
Images have still valuable arguments in giving the desired success to your presentations as compared to text descriptions. When you need to present various data values over the web, graphs and charts provide a more intuitive alternative to show them eliminating the need of tables or simple text.
There are many possibilities to create graphs and charts from your data. For example, you can use the favorite plotting software, export the graphical representation of your data as image (png or jpeg is recommended due to the low image file size) and then include them on your web page.
But this indirect option could be time consuming and is not always a solution to publish data values as professional graphs or charts on web pages. Fortunatelly, the existing web programming language allows the creation and publishing of graphs and charts on web pages directly from your data values with the help of client side or server side scripts.
The most of ready made scripts or libraries for graphs and charts publishing require programming knowledge in order to obtain a certain graphical representation of data values on web pages, like Emprise JavaScript Charts.
FusionCharts provides an automatic method of creating animated graphs and charts from any type of data values. It is a Flash component (requires Adobe Flash Player 8 browser plugin on client side) easy to use in combination with any server side language as well as stand-alone embedded on simple HTML pages. To publish a graph or a chart on an HTML page, you will need to have the data values contained in a XML file, to select the swf file that generates the graphical representation according to the graph or chart type and to create the HTML code necessary to display the Flash movie. The XML file and HTML code can be created manually or automatically.
The distribution archive contains a tool named XMLGenerator that allows you to automatically create the XML file containing the data values. It provides the possibility to manually enter data or to import data from .xls, .csv or other data file type. The HTML code is generated based on chart configuration.
The Flash chart can be embedded in HTML as an object or with the help of JavaScript. In the second case, the JavaScript file must be included also in the same directory with the HTML file. If you want to change the graph or chart type, you must select the desired .swf file from the Charts directory contained in the FusionCharts distribution archive and modify the corresponding entry in the HTML code.
The FusionCharts utility will help you create original presentations with eye-catching animated graphs and charts. All graphical representation characteristics like axis title, dimension, colors and more are easy to define and control. If you want to publish graphs or charts on web pages with FusionCharts, it can be downloaded here.

 14 DAY TRIAL //