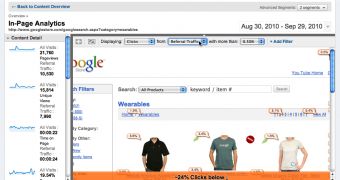
Google Analytics is introducing a new tool for those who's idea of a fun afternoon does not involve weeding through pages upon pages of numbers, graphs and obscure terminology. The new In-Page Analytics feature provides a simple and intuitive way of analyzing your site's traffic.
"Today, we’re happy to share with you a bit of what we’ve been working on to address this problem," Trevor Claiborne, Google Analytics Team, wrote.
"We’re releasing a new feature into beta: In-Page Analytics. With In-Page Analytics, you can see your Google Analytics data superimposed on your website as you browse," he announced.
"To make [visualizing how visitors navigate] easier, some users keep the website open in another browser tab so they can reference it while looking through reports. Others rely on the Site Overlay report in Google Analytics, which, admittedly, hasn’t worked as well it could," he explained.
The new In-Page Analytics tool is available in the Content section and is still labeled as beta, so there may be some small issues. Google has a habit of releasing everything in beta so it shouldn't matter too much.
It's only available in the English version of Analytics. In-Page Analytics also replaces the ill-fated Site Overlay.
With In-Page Analytics you'll be able to see your site with small labels superimposed over the links, showing how frequently they are clicked. You can also get more detailed stats by clicking on any of the labels.
However, especially for a complex site with a lot of traffic, the data can easily become overwhelming so Google built in a number of filters to help users narrow down on the data they need.
For example, you can see the labels of the links that get at least an amount of usage. You can also focus on a segment of the demographic, depending on region for example, or on the more technical aspects such as browser and screen resolution.
The new feature is live, again, only for the English language version, so you can take it for a spin now.

 14 DAY TRIAL //