14 DAY TRIAL //
 Google Earth has always surprised us with the innovative functions implemented in it and it seems like the mapping solution will keep up the good work for a long time from now on. Although it doesn't belong to the folks working at the Mountain View company, a new database is now available on the web, allowing Google Earth users to view the warming trend for certain cities around the world.
The database was built by Ken Mankoff of NASA and Mark Chandler of Columbia University, who used information from NASA and many other sources. The entire amount of information was packed into a single KML file, which is compatible with most Google Earth versions currently on the web.
"Our goal is to provide an interactive tool for the exploration of climate change at global, regional, and local scales," the two researchers wrote on the official page of the project.
"The current product shows temperature change at individual stations, providing a microscopic view of the data (ungridded, individual stations, and individual months for each station) that allows people to examine how their local temperature changes over time. This view does not provide a scientifically robust method for analyzing global warming because of inconsistencies and complexities associated with the recording of temperatures at the station level," the scientists added.
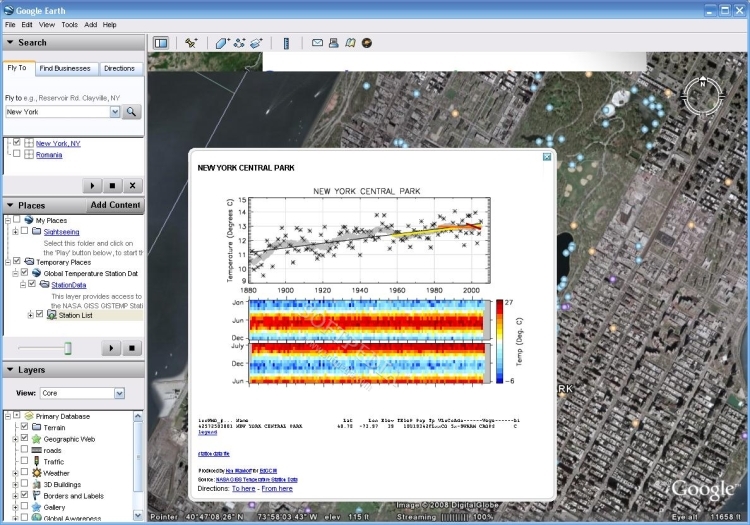
In case you'd like to use the file with your own Google Earth installation, you have to follow a few steps: supposing you have already downloaded and installed Google Earth, download the database provided by the two researchers using this link. In Google Earth, click on File/Import and select the downloaded file. Wait a few seconds until the applications load the entire database, zoom in and click on any marker you want in order to access the graphs.