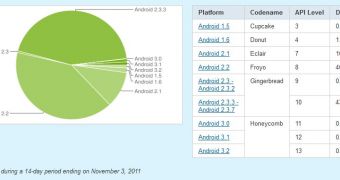
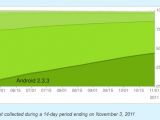
Google has just made available new Android distribution charts aimed at offering developers a better understanding of the distribution of the various mobile OS flavors on the devices that are accessing the Android Market.
According to data collected during the two weeks ended November 3rd, the Gingerbread release took the lead on charts, being present on 44.4 percent of all active Android devices out there.
The Android 2.3 - Android 2.3.2 flavors were loaded on 0.5 percent of devices, while the Android 2.3.3 - Android 2.3.7 platform iterations were present on 43.9 percent of them.
The Gingerbread OS version needed about one year to become the top Android release, as it was launched back in December last year, on Samsung's Nexus S.
The said charts also show that the older Android 2.2 Froyo OS version was loaded on 40.7 percent of devices that accessed the Android Market in the past two weeks or so.
Android Honeycomb was loaded on 1.9 percent of active devices in the time frame, with the various releases distributed as follows: Android 3.0 on 0.1 percent devices, Android 3.1 on 0.9 percent of them, and Android 3.2 also on 0.9 percent devices.
The new Android distribution charts also show that older releases of the platform are benefiting from a weaker presence in the Android Market.
Android 2.1 Eclair was loaded on 10.7 percent devices out there, Android 1.6 Donut was loaded on 1.4 percent of them, while Android 1.5 Cupcake was present on only 0.9 percent active Android devices.
As stated above, the data is meant to offer developers an overview of which Android platform flavors are most used for accessing the Android Market. This way, they can better manage the building of applications for a specific platform release or another, or for more of them.
Soon, the Android distribution charts might change again, since a new OS flavor is headed for shelves, Ice Cream Sandwich, which should be loaded on both smartphones and tablet PCs, which means increased distribution on the market.

 14 DAY TRIAL //
