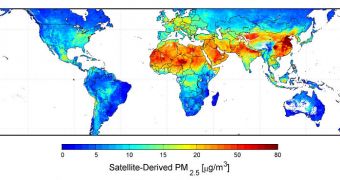
Assessing the amount of fine particulate matter (PM2.5) in the Earth's atmosphere was one of the most difficult things to do until now, given the lack of infrastructure capable of makings such measurements.
But this summer saw the release of the first long-term global map of PM2.5, a tool that is bound to become indispensable to researchers looking to study the planet's atmosphere.
In many parts of the world, there are literally no atmospheric sensors installed on the ground, which means that readings of how much of these particles exist are scarce at best. As such, it stands to reason that scientists turn to satellite data, so that they can obtain at least a rough estimate of the abundance of this subcategory of airborne particles in the atmosphere.
PM2.5 are smaller than 2.5 micrometers, and are therefore very difficult to observe. They are 10 times thinner than a human hair, researcher ssay .
One of the main things that makes them dangerous, and therefore worthy of study, is the fact that their small sizes allow them to penetrate deep into the human body, and especially inside the lungs.
They can cause numerous respiratory diseases and infections, and the World Health Organization (WHO) estimates that the particles are the cause of millions of premature death yearly.
But, regardless of how hard experts tried, compiling a map of PM2.5 was impossible, especially for the near-surface air, which is very difficult to analyze from orbit.
Bright land surfaces, such as snow and desert, combined with cloud covers, made such studies impossible. And yet we now have a map of fine particulate matter distribution.
It was created by experts at the Dalhousie University, in Halifax, Nova Scotia, Canada, who were lead by researchers Aaron van Donkelaar and Randall Martin.
Details of the work are published in the latest issue of the esteemed scientific journal Environmental Health Perspectives, officials at the American space agency write in a press release.
The map was produced by mixing measurements of total-column aerosol amounts with vertical aerosol distribution patterns derived from a computer model.
“We still have plenty of work to do to refine this map, but it's a real step forward. We hope this data will be useful in areas that don't have access to robust ground-based measurements,” says Martin.
“We can see clearly that a tremendous number of people are exposed to high levels of particulates. But, so far, nobody has looked at what that means in terms of mortality and disease,” he adds.
“Most of the epidemiology has focused on developed countries in North America and Europe,” Martin concludes.

 14 DAY TRIAL //