Google Docs is adding a number of more advanced chart types to its spreadsheet editor. It's also adding the possibility of taking a snapshot of a chart and easily pasting it into documents or drawings.
"Today, we’re releasing a few new types of charts, plus a feature that allows you to copy your charts from spreadsheets into documents and drawings. Sound good? Bet your bar chart it does," Ben Margolin, software engineer at Google, writes.
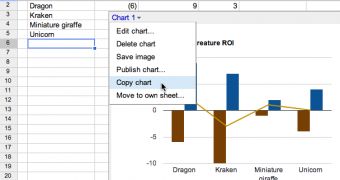
Copying a chart to another Docs document is rather straightforward. Just select the chart you want to share, click on the arrow next to its name to bring up the menu and then select "Copy chart."
The chart will then be available in the web clipboard, ready to be pasted into any document or drawing. Just open the document you want, go to the place where you want the chart inserted and then select it from the web clipboard menu button.
"As you hover the mouse over the menu item for the chart, a thumbnail will be displayed. Clicking on the chart item will paste it into the document as an image, which can then be resized, aligned, etc," Google explained.
The pasted chart is just an image, it isn't linked to the original spreadsheet and will not be updated if the data sets change.
Along with the new feature, Google is also introducing several new chart types, which should come in rather handy in several cases.
The simplest addition is the candlestick chart, which has a very descriptive name. This type of chart is used to differentiate between negative and positive values, when showing only an absolute variance in the regular axis.
Combo charts, as the name implies, enable users to mix several chart types, for example a bar chart with a line chart. Another addition is the GeoMap chart, useful for data relating to countries. Finally, there is a new TreeMap chart as well.

 14 DAY TRIAL //