14 DAY TRIAL //
 Internet Explorer is undoubtedly one of the most controversial software solutions released by Microsoft and bundled into Windows, and the hate created around the browser is nothing new for tech-savvy users.
Many call Internet Explorer “the best browser to download Chrome,” while others believe that its market share is so big mostly because Microsoft offers it as the default Windows browser, so it’s really hard to determine whether someone actually uses this app or not.
And when looking at statistics provided by two of the most important analysis firms out there, the mystery goes deeper, with both providing mixed results for Internet Explorer’s market share
StatCounter: Google Chrome number one
StatCounter is one of the companies that put Internet Explorer behind Google Chrome, and there are voices out there that accused the firm of being backed by Google in one way or another.
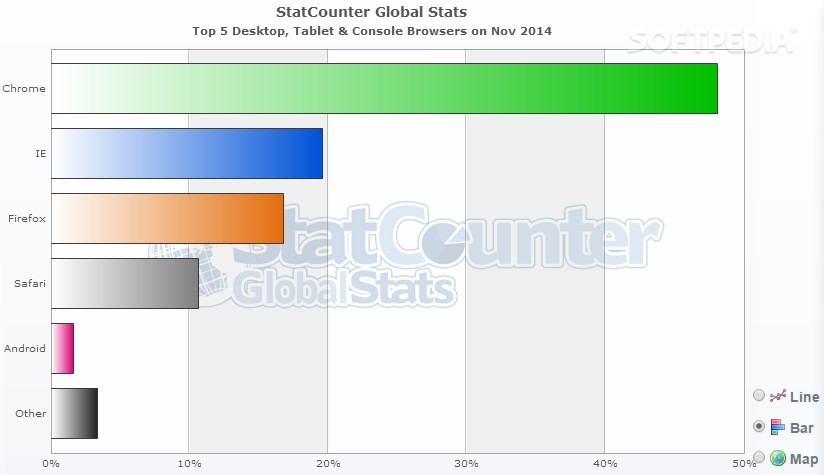
While the truth behind this story isn’t really important because browser share stats should remain accurate no matter the owner of the company, StatCounter claims that Chrome was the number one browser in November with a share of 48.06 percent.
Internet Explorer came second with 19.6 percent, so less than a half of Chrome’s share, while Firefox was third with 17.74 percent.
Note that these figures point to the market share of all versions of these browsers, and do not reveal any figures regarding specific build numbers for any of them.
NetMarketShare: Internet Explorer, the leading browser
As far as NetMarketShare is concerned, some people out there claim that Microsoft is actually behind this company, so the results it provides shouldn’t be such a big surprise.
This time, Internet Explorer is said to be on the first place with a share of 58.94 percent, followed by Chrome with 20.57 percent, which means that it has less than half the users of Microsoft’s in-house browser. Firefox is again third with 13.26 percent.
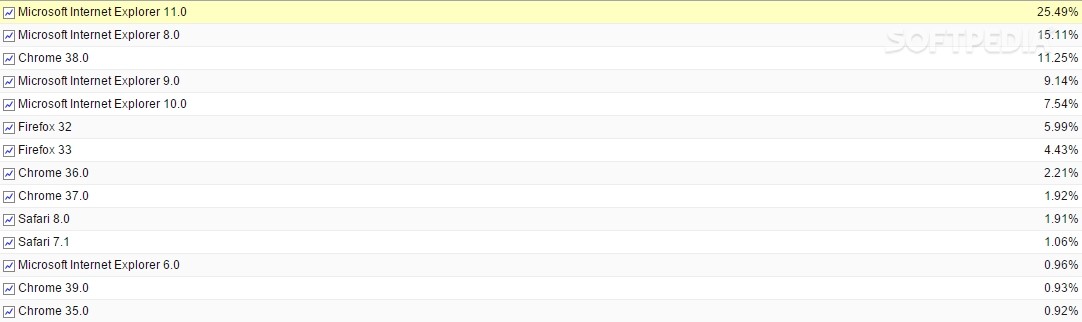
Version-wise, Internet Explorer 11 leads the pack with 25.49 percent, while Internet Explorer 8 is the runner-up with 15.11 percent. Chrome 38 is on the podium with 11.25 percent, while Firefox 32 is far behind with only 5.99 percent.
The actual truth
Judging by these figures, it’s really hard to determine the number one browser out there because it all comes down to a system that could easily lead to inaccurate data. Some of these stats are based on ad impressions or own networks, so numbers can vary depending on a wide array of factors.
NetMarketShare describes its methodology on the official website:
“We collect data from the browsers of site visitors to our exclusive on-demand network of HitsLink Analytics and SharePost clients. The network includes over 40,000 websites, and spans the globe. We ‘count’ unique visitors to our network sites, and only count one unique visit to each network site per day.”
StatCounter, on the other hand, uses code bundled into websites to collect data such as operating system market share, browser, screen resolution and location.
The bottom line is as simple as it could be: while tops and charts can easily be made using data collected from users, there’s no such thing as “the best browser.” The browser you should use is the one that suits you best, and you can only figure out your best option by having a look at each of them before anything else.